
PROJECT CONTROLS INSIGHT
Why Cost and Schedule Performance Diverge?
Cost and Schedule Performance can diverge when project expenditure, work progress, and completion forecasts respond differently to execution conditions. A project may remain within budget while critical activities fall behind, or improve schedule performance through recovery measures that increase costs. Neither situation, on its own, establishes whether the project is healthy or at risk.
This Insight examines why cost and schedule indicators can tell different stories about the same project, how measurement limitations, work sequencing, delayed cost effects, and recovery decisions contribute to divergence, and what project professionals should reconsider to interpret performance accurately and make better-informed decisions.
Professional Insight · Project Controls · 18–22 min read
Introduction
Cost and Schedule Performance can tell different stories about the same project. Expenditure may remain within budget while critical activities fall behind. Conversely, a project may recover lost time while spending more than planned. These situations are not necessarily contradictory. They often reflect different aspects of project execution, measurement, and forecasting.
However, favourable cost performance does not automatically mean the project is healthy. Similarly, a schedule variance does not, by itself, explain the likely effect on the final completion date. Professionals must look beyond individual indicators to understand what is happening across the project.
This Insight examines why cost and schedule indicators diverge, what underlying conditions can create conflicting signals, and why routine reporting may fail to explain them. It also explores how recovery actions, work sequencing, measurement limitations, and delayed cost effects influence performance interpretation.
The objective is practical: help project professionals investigate conflicting signals, challenge unsupported assumptions, and reconcile cost and schedule forecasts before making decisions. Rather than treating each indicator as a separate verdict, the focus is on understanding how both reflect the same project reality.
The Common Assumption
Project teams often interpret cost and schedule indicators as if they provide a consistent picture of project health. However, spending less than planned or reporting progress close to target does not necessarily mean the project remains on track. Each indicator measures a different aspect of performance, and its meaning depends on the underlying work and assumptions.
Why Being Within Budget Does Not Necessarily Mean the Project Is Healthy
Actual expenditure may remain below plan because the team has completed less work than expected. Delayed installation, procurement, or mobilisation can postpone costs rather than eliminate them. Consequently, the project may appear financially healthy while future expenditure increases through extended site overheads, equipment rental, or overtime.
Spending less is not the same as delivering efficiently. Professionals must compare actual costs with completed work and investigate whether favourable variances reflect genuine savings or delayed execution.
How Cost and Schedule Performance Can Deteriorate Differently
Different activities face different productivity levels, resource constraints, procurement delays, and rework. For example, a project may complete several low-cost activities on time while a critical equipment installation falls behind. Overall progress may look acceptable, yet the delayed installation could threaten testing and commissioning.
Conversely, additional shifts or specialist resources may recover lost time while increasing costs. Therefore, improving schedule performance can create additional cost pressure, depending on the recovery strategy and remaining work.
What a Schedule-Performance Index Actually Tells Us
Earned Value Management compares earned value with planned value. The Schedule Performance Index (SPI) expresses this relationship as a ratio. An SPI below 1.0 indicates that earned value trails planned value, but it does not directly quantify calendar delay.
Professionals must also examine critical-path activities, remaining durations, and schedule logic. A performance index provides evidence, not a complete completion forecast.
Why Favourable Indicators Cannot Establish Overall Project Health
Cost and Schedule Performance indicators can each be accurate while the overall assessment remains incomplete. Reports may show current expenditure and completed quantities without revealing difficult remaining work, unresolved constraints, or unrealistic recovery assumptions.
A reliable assessment connects cost data, schedule logic, scope status, resource requirements, risks, and forecast assumptions. It also checks whether reporting dates align. Ultimately, professionals must investigate what each indicator reveals, what it excludes, and how those conditions affect the final outcome.
What Is Really Happening?
Cost and Schedule Performance diverge because expenditure, completed work, and delivery dates respond differently to project conditions. These measures remain connected, but they do not change at the same rate or reveal the same risks. To interpret conflicting signals, professionals must understand the mechanisms behind them rather than assume that one indicator explains another.
How Cost and Schedule Measure Different Dimensions of Performance
Cost measures track expenditure and financial performance against an established reference. Schedule measures examine activity timing, dependencies, milestones, and completion expectations. Although project controls connect these dimensions, each uses different data and assumptions.
For example, a project may spend less than planned because fewer resources have been deployed. Meanwhile, activities may already be losing time against their required dates. Conversely, spending may exceed plan because the team has accelerated work to protect a critical milestone.
Therefore, professionals should examine the reason behind each variance. The relationship between cost and schedule depends on what work occurred, where it occurred, and how the team executed it.
Why Work Progress Does Not Always Translate into Completion Progress
A project can complete substantial quantities without making equivalent progress towards its final completion date. This happens when completed activities carry limited influence over the remaining schedule, while unfinished activities constrain subsequent work.
Consider an infrastructure project that completes several non-critical installations ahead of plan. However, a delayed utility connection prevents system testing from starting. Overall physical progress may look strong, but the project cannot complete commissioning until the connection becomes available.
Schedule network logic explains this difference. Progress volume alone does not establish completion readiness. Professionals must identify critical and near-critical activities, verify dependencies, and assess whether completed work enables the next stages.
When Schedule Effects Appear Before Their Full Cost Consequences
Schedule delays can emerge before their full financial consequences appear in reported costs. A procurement delay, for instance, may leave installation teams waiting while planned expenditure remains temporarily low. Later, the same delay may extend supervision, site facilities, equipment hire, and subcontractor support.
Cost recognition and payment timing can also differ from the timing of physical performance. Consequently, a reporting period may capture the schedule problem without capturing all its financial effects.
Professionals should therefore connect schedule changes to their likely cost consequences. They need to examine time-related overheads, resource extensions, contractual exposure, and the cost of completing the remaining work. A favourable current variance may conceal future cost pressure.
How Recovery Actions Can Improve Schedule Performance While Increasing Cost
Teams sometimes respond to delays by adding shifts, deploying extra resources, expediting deliveries, or changing construction sequences. These actions may recover time, but they can also increase direct costs and create productivity or coordination challenges.
For example, additional crews may accelerate a delayed installation. However, restricted work areas, supervision limits, or trade interference may reduce the expected productivity gain. The project may incur additional expenditure without recovering the planned duration.
Recovery decisions must therefore balance time gained, cost incurred, execution feasibility, and residual risk. Professionals should verify whether the proposed measures affect activities that genuinely control completion. A recovery plan needs measurable assumptions and evidence of results, not just additional resources.
Where Scope Changes, Rework and Execution Constraints Affect Performance Differently
Scope changes, defective work, design clarification, and resource constraints can affect cost and schedule through different pathways. Rework may consume labour and materials while delaying follow-on activities. A scope addition may increase both planned expenditure and duration, but its effect depends on approval timing and integration with existing work.
Meanwhile, unresolved design information or late materials may restrict progress without immediately producing equivalent recorded costs. Different work packages can also experience different conditions, making project-wide averages less informative.
Professionals should trace significant variances to specific work packages, constraints, and approved changes. They should distinguish authorised scope growth from avoidable rework and temporary disruption from persistent productivity problems. This analysis helps explain the divergence and supports more credible cost and completion forecasts.
Why Do Professionals Miss the Problem?
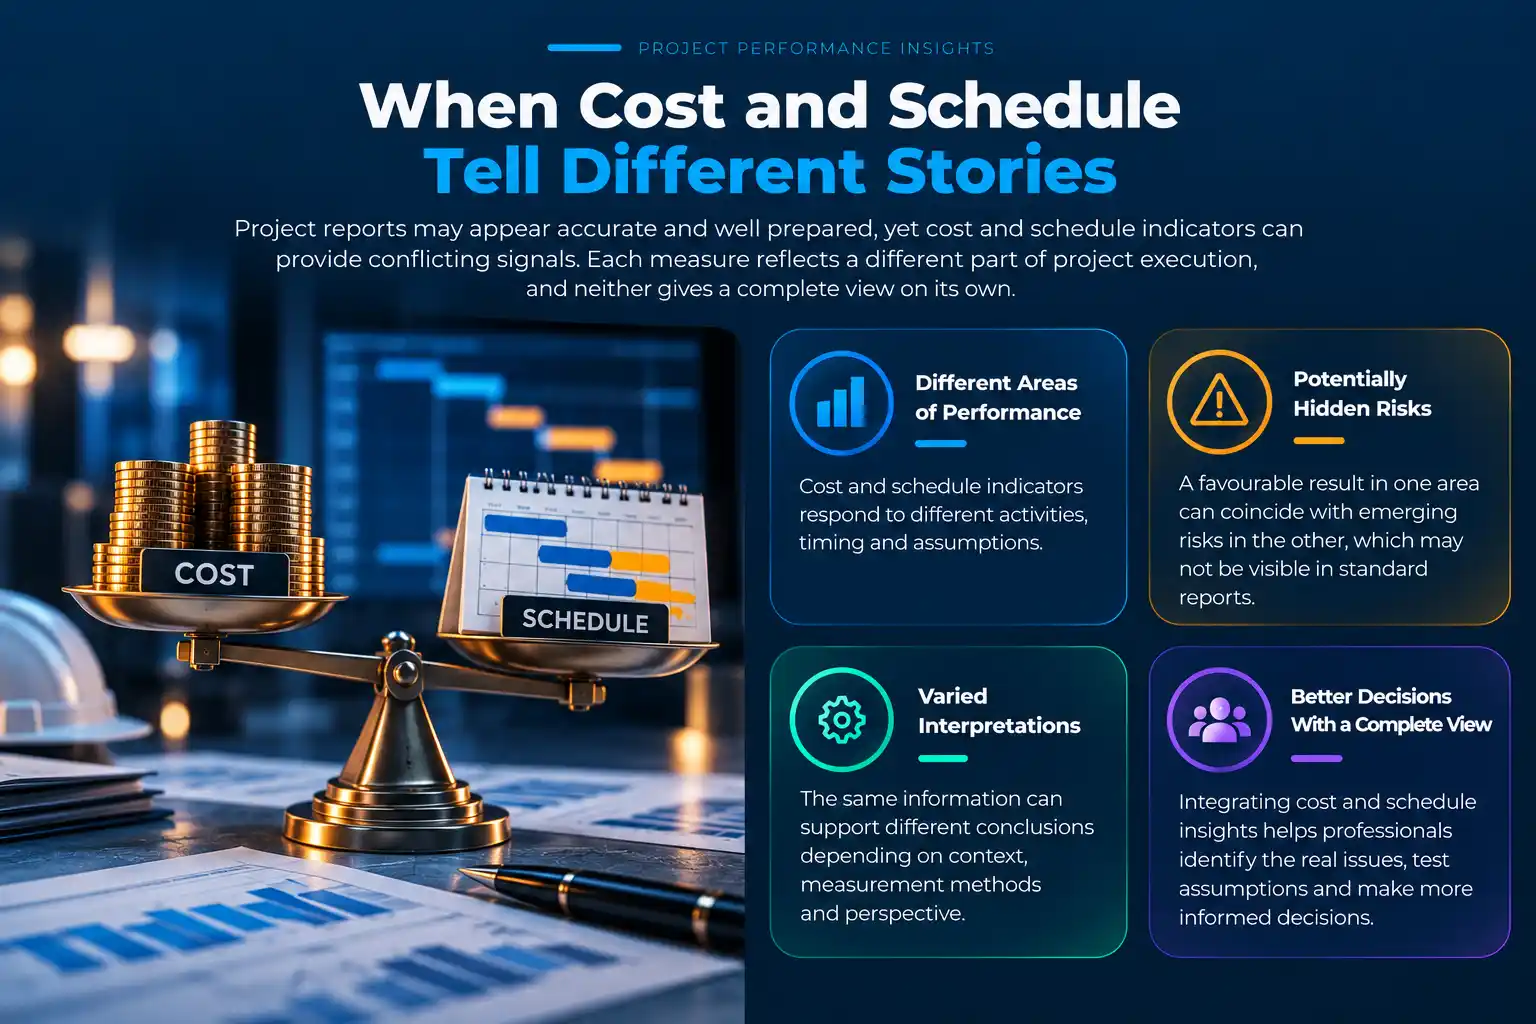
Conflicting cost and schedule signals do not always go unnoticed. Often, teams report the figures correctly but fail to connect them to important decisions. Reporting routines, narrow performance targets, delayed information, and untested assumptions can prevent professionals from recognising the significance of divergence.
The challenge is not simply collecting better data. It is interpreting that data in context, questioning reassuring results, and identifying what current indicators cannot reveal about the final outcome. Understanding Cost and Schedule Performance requires professionals to look beyond summary figures and investigate the conditions behind them.
How Aggregate Indicators Conceal Deteriorating Performance
Project-wide figures can conceal significant differences between work packages. Strong performance in several areas may offset poor performance elsewhere, making the overall position appear stable. However, one delayed package may control commissioning, contractual milestones, or downstream activities.
For example, completed work across non-critical areas may keep reported progress close to plan. Meanwhile, a delayed system integration activity may threaten the completion date. Similarly, favourable cost performance in one package may conceal escalating expenditure in another.
Professionals should move beyond summary indicators when signals conflict. They should investigate the work packages, milestones, and constraints driving the overall position. Aggregation helps communicate performance, but it can conceal the location and significance of emerging problems.
Why Indicators Are Mistaken for Conclusions
A performance indicator describes a measured relationship. It does not automatically explain the cause, future consequence, or appropriate response. Yet teams may treat a favourable variance as proof of control or an acceptable schedule index as evidence that completion remains secure.
This interpretation skips the diagnostic work between measurement and decision. An SPI near 1.0, for example, does not independently confirm that critical activities remain achievable. Likewise, expenditure below plan does not establish that the remaining work will stay within budget.
A stronger review asks what produced the result, which assumptions support it, and what additional evidence could challenge the initial interpretation. Indicators should trigger investigation, not replace professional judgement.
When Future Cost Exposure Remains Hidden
Current expenditure often receives more attention than the cost of completing the remaining work. However, delayed activities can create future overheads, resource extensions, acceleration costs, and contractual exposure. These effects may not appear fully in actual costs when teams first identify the schedule problem.
Forecasts become unreliable when teams carry forward historical spending patterns without reassessing execution conditions. For instance, a project may retain its original cost forecast despite an extended completion date and additional site-support requirements.
Professionals should revisit the estimate to complete whenever significant schedule or execution assumptions change. They should also identify cost effects linked to duration, productivity, procurement timing, and recovery decisions. This prevents a favourable current position from creating false confidence in the final cost.
How Untested Recovery Assumptions Distort the Outlook
Recovery plans can create confidence before teams demonstrate that proposed actions will work. A plan may assume additional resources, faster installation, improved productivity, or expedited materials. However, these assumptions may overlook access restrictions, resource availability, technical dependencies, and coordination limits.
When forecasts accept these benefits without sufficient evidence, they may understate completion risk and recovery cost. Consequently, the reported outlook can improve even when actual execution has not changed.
Professionals should test recovery assumptions against realistic productivity, resource capacity, schedule logic, and demonstrated progress. They should distinguish proposed recovery from achieved recovery and update forecasts when results differ from expectations.
Why Reporting Volume Can Obscure Decision-Relevant Signals
Large reporting packs do not guarantee better decisions. Numerous charts, status indicators, variance explanations, and work-package updates can overwhelm the issues requiring management attention. Important relationships may remain buried when reports present cost and schedule separately.
A useful review should make conflicting signals and their implications explicit. Professionals can strengthen that review by asking whether the report clearly identifies:
- Which activities or work packages drive the divergence?
- What explains the current cost and schedule positions?
- How could the divergence affect final cost and completion?
- Which assumptions remain uncertain or unverified?
- What decision, owner, or follow-up action is required?
These questions shift reporting from presenting information towards supporting decisions. The aim is not to reduce every report to a few numbers. Instead, detailed evidence should lead to a clear explanation and a proportionate response.
Where Baseline and Forecast Assumptions Escape Scrutiny
Performance assessments depend on the quality and relevance of their reference points. An outdated schedule, unrealistic productivity assumption, poorly integrated change, or inconsistent reporting date can weaken comparisons. Teams may then debate variances without recognising that the baseline or underlying data requires review.
However, changing the baseline does not resolve the underlying problem. Approved changes should follow appropriate governance, while forecasts should reflect current evidence without concealing performance against original commitments.
Professionals should validate data dates, approved scope, schedule logic, and cost assumptions before drawing conclusions. Ultimately, reliable interpretation requires trustworthy measurements and credible reference points to assess Cost and Schedule Performance fairly.
What Happens If It Continues?
When professionals fail to investigate conflicting performance signals, the consequences can extend beyond the original variance. Delays may increase future expenditure, recovery options may narrow, and management decisions may rely on unrealistic forecasts. These outcomes are not inevitable. However, the risks increase when teams repeatedly accept favourable indicators without testing their underlying assumptions.
The central concern is that unresolved divergence can weaken the connection between reported performance and delivery decisions. Understanding Cost and Schedule Performance requires professionals to recognise how current conditions affect remaining work, financial exposure, and completion commitments.
How Unresolved Divergence Weakens Cost Forecasts and Completion Commitments
Cost forecasts become less credible when teams assess expenditure without accounting for changes in execution and completion timing. A delayed activity may extend site overheads, equipment hire, supervision, or subcontractor support. Meanwhile, an unchanged forecast may still reflect the original duration and productivity assumptions.
Schedule commitments face similar pressure when teams rely on aggregate progress instead of examining remaining activities and dependencies. A project may report acceptable progress while critical work becomes increasingly difficult to complete within planned dates.
Consequently, favourable indicators can coexist with deteriorating cost and completion forecasts. Professionals must update both forecasts when evidence changes, rather than allowing historical assumptions to determine the future outlook.
Why Recovery Options Become More Constrained Over Time
Early intervention often gives teams more choices. They may resequence activities, resolve design constraints, adjust procurement priorities, or redirect available resources. However, these options can diminish as dependencies tighten, resources become committed, and contractual milestones approach.
For example, a delayed equipment delivery may initially allow alternative work to proceed. Later, the same delay may block installation, testing, and commissioning. Recovering lost time could then require expensive logistics, additional shifts, or coordinated work across several contractors.
Not every delay can be recovered economically. Therefore, professionals should evaluate available options early and compare their expected time savings, costs, feasibility, and residual risks. Recognising divergence sooner preserves choices, but it does not guarantee successful recovery.
When Fragmented Management Decisions Undermine Delivery
Cost and schedule teams may reach different conclusions when they work from separate reports, assumptions, or reporting dates. Cost teams might recommend limiting expenditure, while schedule teams request additional resources to protect completion. Without a shared assessment, each decision may appear reasonable within its own discipline.
However, isolated decisions can create unintended consequences. Reducing resources may increase delays, while accelerating work without reviewing cost exposure may undermine the budget. Similarly, procurement decisions based solely on purchase price may overlook the schedule consequences of later delivery.
An integrated review helps management evaluate these trade-offs before approving action. It should connect each decision with its effects on remaining work, forecast cost, milestone commitments, and project risk. Effective Cost and Schedule Performance management requires a shared view of these consequences, rather than separate decisions based on isolated indicators.
How Corrective Actions Can Address Symptoms Rather Than Causes
When reported performance deteriorates, teams may react to visible symptoms without investigating their underlying causes. They might add labour to address low productivity, expedite materials to address a delay, or impose spending restrictions to address a cost variance.
These actions may help in some circumstances. However, additional labour will not resolve missing design information, and expedited materials will not necessarily overcome restricted access or incomplete predecessor work. Likewise, spending restrictions may worsen delivery if they remove resources from activities controlling completion.
Before implementing corrective action, professionals should establish the cause, identify the affected activity, and assess the intervention’s likely consequences. They should then monitor whether the action produces the expected result. A corrective action is effective only when it addresses the problem driving the variance.
Why Emerging Risk Exposure Can Grow Before Major Variances Appear
Some project risks develop before they produce large reported variances. Unresolved design decisions, uncertain supplier dates, declining productivity, or repeated rework may initially affect only a few activities. However, their consequences can spread through dependencies and remaining work.
Professionals should watch for conditions that threaten future performance, even when current indicators remain within tolerance. Useful warning signals include:
- Critical activities with deteriorating remaining-duration estimates.
- Repeated productivity shortfalls against realistic work plans.
- Procurement or design decisions that constrain upcoming activities.
- Recovery plans that depend on unconfirmed resources or optimistic assumptions.
- Increasing time-related costs despite apparently favourable current expenditure.
These signals do not prove that a project will overrun. Instead, they identify where further investigation may be necessary. Professionals should assess their likelihood, potential impact, and relationship to current forecasts. This broader review helps interpret Cost and Schedule Performance before visible variances become more serious.
How Stakeholder Confidence Can Weaken
Stakeholders rely on project reports to understand commitments, exposure, and decisions requiring their support. Confidence can decline when reports repeatedly show acceptable performance but later reveal significant cost increases or missed milestones. The issue is not necessarily inaccurate data; it may be incomplete interpretation or delayed escalation.
Credible reporting explains what changed, why it matters, which assumptions remain uncertain, and what management proposes to do. It also distinguishes confirmed outcomes from forecasts and recovery targets.
Ultimately, early transparency gives stakeholders a better basis for decisions. By explaining conflicting signals and updating forecasts promptly, project professionals can reduce surprises and support realistic commitments. The priority is not to eliminate uncertainty, but to make its implications visible while meaningful decisions remain possible.
What Should Project Professionals Reconsider?
When cost and schedule indicators diverge, project professionals should question their interpretation before deciding which measure deserves attention. Both indicators may accurately describe different aspects of execution. The challenge is to understand what drives the divergence, how it affects the remaining work, and whether the current forecasts reflect realistic conditions.
A stronger approach moves beyond reporting variances towards testing assumptions, investigating causes, and evaluating consequences. The following six considerations help professionals interpret conflicting signals and make better-informed project decisions.
Understanding What Favourable Cost Performance Actually Proves
A favourable cost variance does not automatically indicate efficient delivery. Lower expenditure may reflect genuine savings, improved productivity, or better procurement terms. However, it may also result from delayed activities, reduced resource deployment, or costs that have not yet reached the accounts.
Professionals should examine the work completed alongside the expenditure incurred. Under Earned Value Management, comparing actual cost with earned value helps assess cost efficiency, while comparison with planned value helps establish progress against the baseline.
The critical questions are whether the savings are genuine, whether they will persist, and whether remaining work introduces additional exposure. For example, delayed installation may reduce current labour costs but extend site overheads later.
Professionals should accept favourable cost performance only when evidence supports its sustainability. They should also update the estimate to complete when productivity, scope, or execution conditions change.
Assessing Whether Schedule Indicators Represent Completion Risk
Reported progress and schedule indicators do not always reveal whether the project can meet its completion date. Traditional Earned Value Management measures, including Schedule Variance and the Schedule Performance Index, compare earned value with planned value. They provide useful progress signals, but they do not directly quantify calendar delay.
Professionals should therefore examine the activities and dependencies that control completion. Strong progress across non-critical work may not compensate for delays to a critical installation, system integration, or commissioning activity.
A meaningful schedule review should consider:
- Which critical or near-critical activities threaten the completion date?
- Do remaining-duration estimates reflect actual productivity and current constraints?
- Will completed activities enable the planned sequence of remaining work?
- Have procurement, access, design, or resource issues changed schedule logic?
These checks help distinguish a progress shortfall from a genuine completion threat. Where uncertainty remains material, professionals should test alternative durations and assess schedule risk rather than rely on a single indicator.
Reconciling Cost and Schedule Forecasts Against the Same Reality
Cost and schedule forecasts should reflect consistent assumptions about the scope, resources, productivity, and work remaining. If the schedule forecast extends completion but the cost forecast retains the original duration, the two forecasts describe incompatible conditions.
An extended duration may increase site overheads, supervision, equipment hire, and subcontractor costs. Conversely, an acceleration strategy may require overtime, premium freight, or additional resources. Professionals should incorporate these effects when evidence supports them.
A joint forecast review should examine whether both forecasts use consistent data dates, approved scope, and realistic productivity assumptions. It should also identify uncertainties that could materially change final cost or completion.
The approved baseline and current forecast serve different purposes. The baseline provides the reference for measuring performance, while the forecast estimates the expected outcome using current evidence. Updating the forecast must not conceal variance against approved commitments.
Reliable Cost and Schedule Performance analysis requires both forecasts to describe the same underlying project conditions. Where uncertainty remains significant, professionals should compare plausible scenarios instead of relying on unsupported certainty.
Distinguishing a Performance Symptom From Its Root Cause
A variance identifies a difference from the plan, but it does not explain why the difference occurred. Low productivity, for example, may reflect inadequate work preparation, missing materials, design uncertainty, restricted access, or rework. Each cause requires a different response.
Professionals should trace significant variances to specific activities, work packages, and execution conditions. They should distinguish direct causes from contributing factors and test explanations against site records, progress evidence, resource data, and schedule logic.
This distinction matters because corrective actions can address symptoms without resolving the underlying problem. Adding workers will not necessarily improve productivity when incomplete design information prevents work from proceeding.
A sound diagnosis should establish the cause, identify the affected work, assess downstream consequences, and define how the team will verify improvement. Corrective action should follow evidence-based diagnosis, not the appearance of a variance alone.
Testing the Assumptions Behind Recovery Plans
Recovery plans often depend on assumptions about additional resources, faster execution, improved productivity, or expedited procurement. However, a proposed intervention does not guarantee the expected time savings. Site congestion, resource availability, technical dependencies, and coordination limits can reduce its effectiveness.
Before approving recovery measures, professionals should establish which activities control completion and whether the proposed intervention can influence them. They should compare expected duration gains with additional costs, execution risks, and potential effects on other activities.
They should also distinguish planned recovery from demonstrated recovery. Actual progress must confirm whether the intervention works; otherwise, teams should revise the forecast and consider alternatives.
A credible recovery plan therefore includes measurable assumptions, clear ownership, achievable milestones, and defined review points. Additional resources should support a tested recovery strategy, not substitute for one.
Validating the Baseline as a Credible Reference
Performance analysis depends on a reliable baseline and consistent underlying data. An outdated schedule, unrealistic productivity assumption, inconsistent reporting date, or poorly integrated approved change can weaken comparisons. Professionals may then misinterpret variances because the reference point no longer represents the authorised plan.
Baseline reviews should verify approved scope, schedule logic, calendars, time-phased budgets, and formal change records. Teams should also check that cost and schedule reports use compatible data dates and measurement rules.
However, revising a baseline should follow established change control. It must not become a way to erase adverse performance or make results appear acceptable. The original commitments and the current forecast should remain distinguishable.
When professionals validate both the measurements and their reference points, they can interpret divergence more credibly. This provides management with a clearer view of actual performance, emerging exposure, and the decisions required to protect delivery.
A Practical Professional Lens
Understanding conflicting project signals requires more than reviewing separate cost and schedule reports. Professionals need a repeatable way to investigate divergence, test explanations, and determine whether current forecasts reflect actual execution conditions.
The following MEASURE → LOCATE → EXPLAIN → TEST → FORECAST → ACT framework provides a practical sequence for that review. It connects performance measurement with evidence, causal analysis, forecast reconciliation, and corrective action. Kleios Technologies developed this framework as a professional synthesis; it is not a formal external methodology or a validated predictive model.
Measure the Divergence Between Cost and Schedule
Start by identifying where cost and schedule indicators tell different stories. Compare actual expenditure, earned value where applicable, planned progress, milestone status, and current forecast positions. Confirm that the measures use compatible reporting dates, approved scope, and consistent data definitions.
Do not assume that every difference indicates a problem. Instead, establish the size, direction, and significance of each variance. Determine whether the divergence falls within expected tolerances or requires further investigation.
Output: A clear statement of the divergence, its reporting context, and the performance questions requiring investigation.
Locate the Work Driving the Divergence
Move from project-wide indicators to the work packages, activities, and milestones driving the difference. Review critical and near-critical activities, procurement dependencies, resource constraints, and the relationship between completed work and upcoming tasks.
For example, strong progress across non-critical activities may conceal a delayed installation that controls commissioning. Similarly, low expenditure may originate from a work package that has not mobilised as planned.
Output: A prioritised view of the activities and constraints most relevant to cost exposure and completion risk.
Identify the Underlying Performance Mechanism
Determine why the divergence exists. Possible explanations include delayed execution, productivity shortfalls, rework, scope changes, procurement constraints, cost-recognition timing, or recovery measures that increase expenditure.
Separate confirmed causes from assumptions and contributing factors. A delay may explain lower current expenditure, but it does not automatically explain the full forecast cost impact. Trace the relationship between the observed condition and its likely consequences.
Output: A documented explanation of the divergence, including confirmed causes, contributing conditions, and unresolved questions.
Test the Explanation Against Project Evidence
Check whether the proposed explanation matches actual project evidence. Use progress records, schedule logic, resource data, procurement updates, cost commitments, and approved change records where relevant. Challenge explanations that rely only on assumptions or optimistic expectations.
If a recovery plan assumes higher productivity, compare that assumption with demonstrated results and available resources. If delayed work explains favourable expenditure, verify whether the associated costs have merely shifted into later periods.
Output: An evidence-supported assessment that distinguishes verified findings from uncertainty and untested assumptions.
Reconcile the Cost and Schedule Forecasts
Update the cost and completion outlook using consistent assumptions about remaining work, productivity, resources, scope, and execution duration. Assess how schedule changes may affect time-related costs and how proposed acceleration may affect expenditure.
Keep the approved baseline separate from the current forecast. Where uncertainty remains material, compare realistic scenarios rather than presenting one outcome as certain. Ensure that forecast changes reflect evidence instead of simply restoring an acceptable management position.
Output: A coherent cost and schedule outlook, with significant assumptions, uncertainties, and potential consequences clearly identified.
Act on the Findings and Verify the Results
Select corrective actions that address the identified causes and the activities affecting project outcomes. Define ownership, expected benefits, resource requirements, cost implications, and measurable completion criteria.
After implementation, compare actual results with the expected improvement. If progress does not support the recovery assumptions, revise the forecast and consider alternative interventions. Escalate decisions when cost, schedule, contractual, or risk exposure exceeds agreed authority or tolerance.
Output: Assigned actions with measurable outcomes, review dates, and clear escalation requirements.
Apply the Framework to a Realistic Project Situation
Consider an infrastructure project where expenditure remains below plan, but a critical equipment installation falls behind. The team initially interprets the cost variance as favourable. However, investigation reveals that delayed installation has postponed planned expenditure and threatens subsequent testing activities.
The team identifies the equipment delivery and installation sequence as the main constraint. It verifies the revised delivery date, assesses remaining installation duration, and estimates additional site-support costs. It then compares feasible recovery options and updates both forecasts before recommending action.
This example illustrates the framework’s purpose: connect apparently conflicting indicators to the underlying work, test the explanation, and assess the combined effect on cost and completion. The appropriate response depends on the evidence, contractual context, and practical recovery options available.
Embed the Review in the Reporting Cycle
Use the framework during regular project-controls reviews and whenever significant changes affect cost, schedule, scope, or risk. Not every variance requires a full investigation. Prioritise differences that threaten critical milestones, materially change forecasts, or expose weaknesses in important assumptions.
Record the divergence, supporting evidence, agreed explanation, forecast implications, decisions, and follow-up actions. Assign owners and revisit unresolved issues during subsequent reporting cycles. This creates a traceable link between performance information and management decisions.
Over time, this disciplined approach helps teams identify emerging problems earlier and improve forecast credibility. The objective is not to eliminate every divergence, but to ensure that professionals understand its causes and consequences before making important decisions.
Key Takeaways
Cost and schedule indicators can tell different stories about the same project. Understanding this divergence requires more than comparing reported figures. Professionals must investigate the underlying work, test assumptions, and assess how current conditions affect final cost and completion.
- Favourable cost performance does not guarantee project health. Lower expenditure may reflect genuine savings, but it can also indicate delayed work or costs shifted into future periods.
- Progress indicators require context. Earned-value schedule measures help assess progress against the plan, but they do not directly establish calendar delay or completion risk.
- Critical activities matter more than aggregate progress alone. Strong performance across non-critical work may conceal delays that threaten important milestones.
- Recovery actions create trade-offs. Acceleration may protect completion dates while increasing expenditure, and additional resources do not guarantee the expected recovery.
- Cost and schedule forecasts must reflect consistent assumptions. Changes in duration, productivity, scope, and execution conditions should inform both forecasts.
- Reliable decisions require evidence and follow-through. Professionals should identify root causes, validate explanations, assign corrective actions, and verify whether those actions deliver the expected results.
The central lesson is simple: do not treat individual indicators as complete verdicts on project health. Investigate what they reveal, understand what they omit, and connect their implications to the remaining work and expected outcome.
References
The following references support the Insight’s analysis of cost and schedule divergence, earned-value measurement, project-duration forecasting, schedule assessment, and time–cost trade-offs. Each link leads to a verifiable publication or official guidance page.
- GAO Schedule Assessment Guide: Best Practices for Project Schedules. U.S. Government Accountability Office (2015). Guidance on schedule quality, dependencies, critical paths, and reliable schedule assessment.
- Cost Estimating and Assessment Guide. U.S. Government Accountability Office (2020). Best practices for reliable cost estimates, risk analysis, and earned-value management.
- NASA Schedule Management Handbook. NASA (2010). Guidance on schedule development, analysis, management, and control.
- A Comparison of Different Project Duration Forecasting Methods Using Earned Value Metrics. Vandevoorde and Vanhoucke (2006). Examines alternative project-duration forecasting methods.
- A Simulation and Evaluation of Earned Value Metrics to Forecast the Project Duration. Vanhoucke and Vandevoorde (2007). Evaluates earned-value-based duration forecasts.
- An Extension of the EVM Analysis for Project Monitoring. Pajares and López-Paredes (2011). Integrates project risk into performance monitoring.
- Dangers in Using Earned Duration and Other Earned Value Metrics to Measure a Project’s Schedule Performance. Wendell, Lowe, and Gordon (2023). Examines limitations in schedule-performance metrics.
- Project Management with Time, Cost, and Quality Considerations. Babu and Suresh (1996). Analyses trade-offs among time, cost, and quality.
- Time, Cost and Quality Trade-off in Project Management: A Case Study. Khang and Myint (1999). Examines practical time–cost–quality trade-offs.
- Prediction of Project Outcome: The Application of Statistical Methods to Earned Value Management and Earned Schedule Performance Indexes. Lipke and colleagues (2009). Investigates statistical approaches to project-outcome forecasting.
Related Kleios Resources
The following Kleios resources complement this Insight by helping professionals interpret conflicting performance signals, investigate cost and schedule variances, validate progress information, and develop more credible project forecasts.
- How to Monitor Project Cost and Schedule — Learn how to monitor cost and schedule developments together, identify emerging deviations, and establish a clearer view of project performance.
- How to Measure Project Progress Accurately — Understand how reliable progress measurement helps distinguish reported progress from actual work completed and supports more defensible performance assessments.
- How to Analyze Project Cost Variances — Investigate the causes behind cost deviations and distinguish genuine cost improvements from temporary savings or emerging financial exposure.
- How to Build Reliable Project Cost Forecasts — Review remaining work, productivity assumptions, and changing execution conditions to develop more credible cost projections.
- How to Prepare Effective Project Controls Reports — Structure reporting around significant variances, underlying explanations, forecast implications, and the management decisions that require attention.
- Cost Schedule Performance Template — Support structured reviews of cost and schedule performance using a dedicated project-controls template.
- Project Cost Forecasting Template — Organize forecasting inputs and assumptions to support consistent evaluation of expected project costs.
- Project Controls Resources — Explore the wider Kleios collection of guides and templates covering performance measurement, monitoring, forecasting, reporting, and project control.
Together, these resources support a more integrated approach to project controls: measure performance reliably, investigate conflicting signals, validate the underlying evidence, reconcile cost and schedule forecasts, and connect findings to corrective action.
FEATURED PROJECT CONTROLS INSIGHTS
Professional Perspectives on the Challenges Project Controls Face
Our featured Project Controls Insights examine recurring challenges involving early warning signals, cost variances, progress measurement, forecasting, reporting, and integrated performance. Moreover, they encourage professionals to look beyond reported figures and consider the conditions influencing them.
Why do Project Controls Miss Early Warning Signals
Examine why Project Controls Miss emerging problems despite regular monitoring, reporting, and performance reviews. Therefore, explore how weak signals, delayed information, and changing conditions can reduce early visibility.
Why do Project Cost Variances Keep Growing
Explore why Cost Variances Keep Growing despite established budgets, monitoring, and corrective actions. However, changing scope, productivity, commitments, assumptions, and execution conditions can influence variance behaviour.
When do Progress Measurements Mislead Project Decisions
Examine when Progress Measurements Mislead project decisions despite established measurement methods. Therefore, consider whether reported progress accurately represents completed work and supports effective management action.
MORE PROJECT CONTROLS RESOURCE TYPES
Continue Your Project Controls Learning
Project controls knowledge becomes more valuable when professionals can understand concepts, apply structured tools, and examine their practical use. Explore our other Project Controls resources to complement the analytical perspectives provided by these Insights.
Guides
Explore clear guidance to understand project controls concepts, evaluate performance, and apply effective approaches throughout project delivery.
Downloads
Access useful project controls materials and reference resources to support learning, analysis, and day-to-day project work.
Career Roadmaps
Follow structured learning paths to develop project controls knowledge, practical skills, tools, and capabilities for professional growth.
Templates
Use structured Project Controls templates to support setup, progress measurement, cost analysis, forecasting, performance monitoring, and reporting.
Case Studies
Explore realistic project controls situations, decisions, challenges, and outcomes to understand how control practices work during project delivery.
Glossary
Find clear explanations of project controls, cost management, progress measurement, forecasting, performance analysis, reporting, and related terminology.
Looking for more project management resources? Explore the Kleios Technologies Resources Hub to discover our complete collection of guides, templates, downloads, career roadmaps, case studies, glossary resources, and insights.
RELATED KNOWLEDGE DOMAINS
Continue Your Learning Across Related Knowledge Domains
Project Management is closely connected with specialized disciplines that support successful planning, execution, governance, performance measurement, and professional growth. Explore related knowledge domains to expand your expertise, develop complementary skills, and access practical resources across the complete project management ecosystem.
Expand your expertise one domain at a time and build a well-rounded project management skill set.
Why Explore Related Domains?
- Develop cross-functional project management expertise
- Discover specialized knowledge beyond core project management
- Access practical resources across interconnected disciplines
- Build a complete professional learning pathway
- Strengthen career readiness through continuous learning
Project Management
Practical project management knowledge, practices, and professional resources.
Project Planning & Scheduling
Planning techniques, scheduling methods, and timeline management resources.
PMO
Governance, portfolio management, and organizational project excellence.
Risk Management
Risk identification, assessment, mitigation, and monitoring resources.
Primavera P6
Professional planning, scheduling, resource management, and reporting.
Microsoft Project
Project scheduling, tracking, reporting, and collaboration resources.
Power BI
Interactive dashboards, reporting, visualization, and project analytics.
PMI Certifications
Certification guidance, exam preparation, and professional development resources.