
PROJECT CONTROLS GUIDE
How to Monitor Project Cost and Schedule
Effective Project Cost and Schedule monitoring requires more than comparing actual results with the approved baseline. Project teams need reliable progress data, connected cost and schedule information, and clear performance indicators to understand where the project stands. This guide provides a practical seven-step approach to establish the baseline, standardize progress measurement, integrate cost and schedule data, monitor performance trends, analyze root causes, take corrective action, and improve forecasting and project control.
Practical Guide · Project Controls
Challenges in Project Cost and Schedule Monitoring
Project Cost and Schedule monitoring becomes difficult when teams cannot connect reliable progress information with current cost, schedule, resource, change, and risk data. Consequently, managers may receive reports without a clear view of the project’s actual position.
Research and industry guidance consistently identify data quality, disconnected systems, inconsistent progress measurement, weak baseline discipline, delayed reporting, and poor integration as major project-controls challenges. These problems can also delay corrective action.
Cost and schedule data often remain disconnected
Project teams often manage cost and schedule information through different structures, systems, and reporting processes. Schedulers may work with activities and WBS elements, while cost teams use cost codes, transactions, and accounting periods.
As a result, teams can struggle to connect what the project has accomplished with what it has spent. PMI research identifies schedule-cost integration and alignment across multiple source systems as recurring cost-control challenges.
Progress measurement can produce unreliable results
Accurate monitoring depends on credible progress measurement. However, projects often collect progress information from contractors, subcontractors, engineers, field teams, and other sources.
Different teams may apply different rules for measuring completion. Therefore, reported percentages can become inconsistent, subjective, or difficult to validate. PMI research also highlights the difficulty of obtaining reliable percent-complete information across multiple subcontractors.
Reporting delays reduce the value of monitoring
Project controls teams need timely information to identify emerging problems. However, field progress, actual costs, commitments, procurement information, and schedule updates may arrive at different times.
Consequently, the monthly report can describe conditions that have already changed. By the time management reviews the results, the project may have lost valuable time to respond.
Poor data quality can distort performance indicators
Performance indicators such as CPI and SPI depend on reliable underlying data. Incomplete, inaccurate, late, or inconsistent inputs can therefore produce misleading results.
GAO reviews have found cases where cost and schedule data lacked sufficient accuracy, completeness, or timeliness. Other reviews also identified data anomalies that reduced confidence in earned value information.
A precise-looking KPI does not guarantee a reliable performance assessment.
Baseline changes can hide the real performance story
Projects often experience approved scope changes, revised schedules, contract changes, and other adjustments. These changes can make performance comparison more complicated.
If teams focus only on the latest baseline, they may lose visibility of earlier delays or cost growth. Therefore, effective monitoring should distinguish between the original baseline, approved changes, current baseline, actual performance, and latest forecast.
Cumulative indicators can hide recent deterioration
Cumulative performance indicators provide useful historical context. However, they can also hide recent changes when strong earlier performance offsets current deterioration.
For example, a project may show an acceptable cumulative SPI while its recent production rate continues to decline. Consequently, monitoring should examine both historical performance and recent trends.
GAO has identified this issue in performance dashboards, where cumulative ratings sometimes failed to emphasize recent performance that management needed for effective oversight.
Reports may show the problem without explaining it
A dashboard can show cost variance, schedule variance, CPI, SPI, and milestone slippage. However, these indicators do not automatically explain why performance changed or what management should do next.
Therefore, effective Project Cost and Schedule monitoring must move beyond reporting numbers. Teams need to connect performance trends with root causes, remaining work, risks, and corrective actions.
The real challenge is not producing more project data. Instead, it is creating a reliable control process that converts accurate, timely, connected information into decisions and actions. Understanding these challenges provides the foundation for examining why they occur and how project teams can overcome them.
Why Project Cost and Schedule Monitoring Problems Occur
The challenges above rarely come from one isolated issue. They usually develop through connected weaknesses in data, baselines, progress measurement, systems, reporting, governance, and decision-making. Understanding these causes helps project teams address the source rather than repeatedly manage the symptoms.
1. Cost and Schedule Structures Do Not Align
Project teams often struggle because cost and schedule data follow different structures. Finance may organize costs by account or commitment, while planners organize work through WBS, activities, and milestones.
Therefore, teams may spend significant time reconciling information before they can assess performance. Different reporting periods can create another mismatch.
Cost data may close monthly while field progress changes daily. As a result, reports may compare information from different points in time.
Without a common structure and reporting calendar, teams cannot easily connect spending with physical progress. This disconnect weakens Project Cost and Schedule monitoring because management sees separate numbers instead of one integrated performance position.
2. Progress Measurement Rules Lack Consistency
Progress measurement becomes unreliable when project teams use unclear or inconsistent rules for determining completion. One team may measure installed quantities, while another may rely on activity percentages or subjective estimates.
Subcontractors can also submit progress using different measurement methods. Consequently, reported progress may not represent the same physical achievement across work packages.
This problem becomes more serious when teams apply high percentages early and leave substantial work for later stages. Such practices can distort earned value, productivity trends, and schedule forecasts.
A clear measurement basis, agreed quantities, weighted milestones, and evidence requirements help reduce subjectivity. Without them, monitoring results may appear accurate while the actual progress position remains uncertain.
3. Baseline Discipline Remains Weak
Weak baseline discipline creates another major cause. Teams may start monitoring before establishing a realistic, logically connected baseline for scope, cost, resources, and schedule.
In other cases, frequent changes can blur the distinction between the original plan and the current approved plan. Therefore, managers may struggle to determine whether a variance reflects genuine performance deterioration or an authorized change.
Poor schedule logic can create additional problems because activities may not represent the actual execution sequence. Similarly, an incomplete cost baseline can weaken cost performance analysis.
Effective monitoring needs a controlled baseline, documented assumptions, approved changes, and historical performance visibility.
4. Project Information Arrives Too Late
Data often arrives late because project teams depend on multiple contributors and manual reporting processes. Field teams collect quantities, contractors submit updates, finance records actual costs, and procurement teams update commitments separately.
Each process may follow a different timetable. Consequently, project controls professionals may receive important information after the reporting cut-off.
They then spend time chasing missing data or using estimates to complete the report. By the time management reviews the results, project conditions may have changed again.
This delay reduces the early-warning value of monitoring. Clear data ownership, reporting calendars, automated interfaces, and defined cut-off dates can improve decision speed.
5. Data Quality and Validation Remain Weak
Poor data quality often starts before information reaches the project controls team. Manual entries, inconsistent coding, duplicate records, missing transactions, incorrect dates, and weak validation can affect both cost and schedule information.
Moreover, teams may use spreadsheets that different users update independently. This creates version-control problems and makes reconciliation difficult.
As a result, project indicators can change because of data corrections rather than genuine performance movement. Management may then question the report or make decisions using unreliable information.
Strong validation rules, controlled data ownership, reconciliation checks, and exception reporting can improve data confidence. Reliable monitoring depends on reliable inputs, not simply sophisticated dashboards.
6. Functional Teams Work in Silos
Organizational silos can prevent project teams from understanding the relationship between cost and schedule performance. Planners, cost engineers, procurement teams, commercial managers, finance staff, and construction teams may focus on their own information and priorities.
Consequently, each function can report a technically correct position without explaining the wider project impact.
For example, a procurement delay can affect material availability, productivity, activity duration, cash flow, and forecast cost. If teams review these effects separately, management may see each issue too late.
Cross-functional reviews, shared performance definitions, integrated reporting, and clear accountability help connect these relationships and create a more complete project view.
7. Teams Rely Too Much on Lagging Indicators
Teams can also focus too heavily on lagging indicators. CPI, SPI, actual cost, and completed quantities describe what has already happened, but they may not reveal emerging exposure early enough.
For example, unresolved design approvals, declining productivity, delayed materials, or increasing change backlog can threaten future performance before the main KPIs move significantly.
Therefore, a project may appear stable while leading indicators show growing pressure.
Effective monitoring combines historical measures with forward-looking signals. Teams should track critical approvals, procurement milestones, resource availability, productivity trends, schedule float, risks, and pending changes.
This combination helps management identify developing problems before they become major deviations.
8. Schedule Quality Does Not Support Reliable Monitoring
Weak schedule quality can undermine both schedule monitoring and cost analysis. A schedule may contain excessive constraints, missing logic, unrealistic durations, weak relationships, or activities that do not represent actual work packages.
Consequently, reported completion dates may not provide a dependable picture of the remaining work. Poor schedule quality also affects earned value and forecasting because planned and earned performance depend on meaningful activities and time-phased values.
GAO guidance emphasizes well-defined activities, logical sequencing, resources, status, and regular updates.
Therefore, teams need schedule health checks alongside routine progress updates. A detailed schedule still needs logical integrity to support effective monitoring.
9. Management Pressure Influences Performance Reporting
Management pressure can influence how teams interpret and communicate project performance. When leaders strongly expect a project to remain within budget or meet a committed date, teams may hesitate to highlight unfavorable trends.
Optimistic assumptions can then remain in forecasts longer than the evidence supports. Similarly, teams may emphasize cumulative performance while overlooking recent deterioration.
As a result, management receives a more favorable picture but loses valuable decision time.
A stronger control environment encourages transparent reporting, evidence-based forecasts, documented assumptions, and constructive challenge. Independent review can also help identify unsupported optimism.
Effective monitoring requires a culture where early warnings trigger action rather than blame.
10. Corrective Actions Do Not Close the Control Loop
Corrective actions often fail because teams treat monitoring as a reporting activity rather than a management cycle. A report may identify a variance, but nobody clearly owns the response.
In other cases, teams assign actions without defining the expected result, deadline, or measurement method. Consequently, an action can remain open for several reporting periods without improving performance.
Teams may also close actions when they complete the task rather than when the problem improves.
Effective control requires a closed loop: identify, analyze, act, measure, reassess, and adjust. This discipline turns monitoring information into measurable improvement.
What Should You Do?
The challenges and underlying causes require a structured approach to Project Cost and Schedule monitoring.
The following methodology connects planning, progress measurement, cost and schedule integration, performance analysis, corrective action, and forecasting. Each step builds on the previous one, helping project teams move from reliable performance information to timely decisions and continuous improvement throughout project delivery.
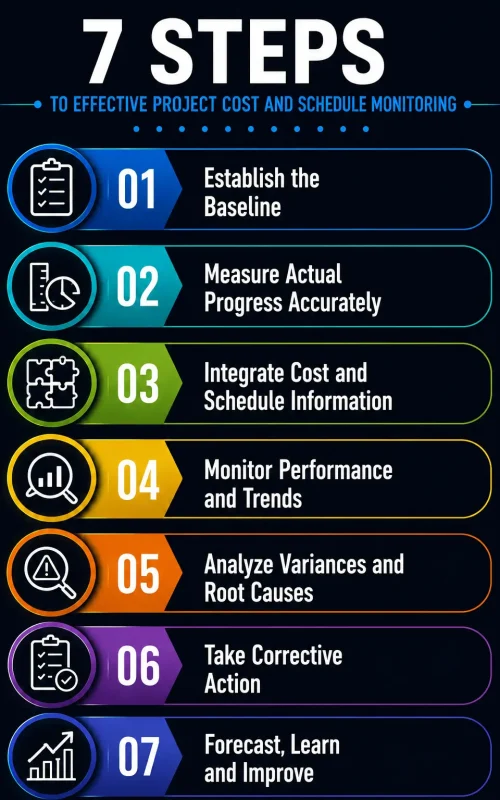
Step 1 — Establish the Baseline
Reliable Project Cost and Schedule monitoring starts with a clear understanding of what the project should achieve, when it should achieve it, and how much it should cost.
Without this reference point, teams cannot reliably determine whether current performance represents normal variation or genuine deterioration.
Define the approved project scope
Start by confirming the scope that the project must deliver. The baseline should represent the approved scope rather than an early estimate that teams have not formally authorized.
Review the WBS, deliverables, work packages, quantities, milestones, and contractual requirements before establishing performance measures.
This step matters because cost and schedule performance only have meaning when teams compare them against clearly defined expected outcomes.
Build a time-phased schedule baseline
Develop the schedule baseline around the approved execution strategy. Activities should represent meaningful work, follow logical relationships, and contain realistic durations.
Include key milestones and completion dates that management can use to assess progress. In addition, link activities to the appropriate WBS and work packages.
A reliable baseline should therefore show when planned work should occur, not simply list activities and target dates.
Establish the cost baseline
The cost baseline should represent the approved budget distributed across the project timeline. Connect budget values with the appropriate WBS, control accounts, work packages, and accounting periods.
Where applicable, include planned labour, materials, equipment, subcontract, and other direct project costs.
Then ensure the time-phased budget aligns with the schedule baseline. This connection allows the team to compare planned expenditure with planned physical progress.
Connect scope, cost, and schedule
The strongest baseline does not maintain scope, cost, and schedule as separate documents. Instead, it connects them through a common structure.
For example, a construction work package should identify the required scope, planned quantities, scheduled activities, budget, responsible team, and expected completion period.
This integration creates the foundation for earned value and performance measurement later in the monitoring process.
- Scope: What work must the project deliver?
- Schedule: When should the work occur?
- Cost: What budget supports the work?
- Responsibility: Who controls the work package?
Document assumptions and constraints
Every baseline contains assumptions. These may relate to productivity, resource availability, procurement dates, access, design information, working hours, or external approvals.
Document these assumptions before monitoring begins. Otherwise, teams may later interpret performance changes without understanding the conditions behind the original plan.
Also record important constraints. A baseline built without its underlying assumptions can create false expectations.
Define the baseline governance rules
Once approved, establish clear rules for changing the baseline. Teams should not revise planned dates or budgets simply because actual performance has deteriorated.
Instead, process legitimate scope or execution changes through the project’s change-control procedure.
Maintain the original baseline, approved changes, current baseline, and actual performance as separate pieces of information.
This historical visibility helps management understand whether a change resulted from genuine performance problems or an approved project change.
Validate the baseline before using it
Do not assume that an approved baseline automatically provides a reliable monitoring foundation. Perform a structured baseline review before starting regular performance reporting.
- Confirm that the scope matches approved requirements.
- Check schedule logic and major milestone dates.
- Verify budget allocation and time phasing.
- Check cost and schedule coding alignment.
- Review assumptions and major constraints.
- Confirm ownership of control accounts and work packages.
After validation, freeze the approved baseline for performance measurement. Then establish a controlled process for recording authorized changes.
Create the foundation for monitoring
A strong baseline gives the project controls team a consistent reference for every subsequent measurement.
It allows the team to ask three fundamental questions:
- What did we plan?
- What have we achieved?
- How does actual performance compare with the plan?
However, the baseline alone cannot tell the project whether reported progress represents genuine physical achievement. The team needs consistent measurement rules before it can make that comparison.
Therefore, Step 1 naturally leads to Step 2: Standardize Progress Measurement. Once the project establishes what should happen, the next task is to define how teams will consistently measure what actually happened.
Step 2 — Standardize Progress Measurement
Once the project establishes a reliable baseline, the next challenge is measuring actual progress consistently. Progress measurement provides the evidence needed to compare planned work with achieved work.
Without consistent measurement rules, different teams can report different progress for the same work. Therefore, standardization must come before reliable performance analysis.
Define what progress means
Start by defining what completion means for each major work package. Avoid relying on general statements such as “50% complete” without supporting evidence.
Instead, connect progress to measurable outputs such as installed quantities, completed deliverables, approved documents, tested systems, or achieved milestones.
This approach makes reported progress more objective. It also creates a stronger connection between physical achievement, earned value, cost performance, and schedule performance.
Select the right measurement method
Not every activity should use the same progress technique. The appropriate method depends on the nature of the work and how clearly teams can measure completion.
For measurable construction work, quantity-based measurement often provides stronger evidence. For design activities, weighted milestones or deliverable-based methods may provide better control.
Common approaches include:
- Quantity-based measurement: Measure completed quantities against planned quantities.
- Milestone measurement: Assign value to clearly defined completion milestones.
- Weighted milestones: Allocate progress across meaningful stages of a deliverable.
- 0/100 or 50/50 methods: Use predefined rules for short-duration activities where appropriate.
- Earned value methods: Calculate earned value using an approved and consistent measurement basis.
The objective is not to select the most sophisticated technique. Instead, choose a method that produces credible, repeatable, and auditable progress information.
Connect progress with physical evidence
Progress percentages should have evidence behind them. Depending on the project, that evidence may include site measurements, inspection records, approved drawings, test results, delivery records, or completed quantities.
For example, a contractor should not claim substantial installation progress simply because materials reached the site.
The team should distinguish between material delivered, material installed, work inspected, and work accepted.
This distinction prevents teams from overstating progress and improves the reliability of earned value calculations.
Standardize rules across project teams
Large projects often involve multiple contractors, subcontractors, disciplines, and locations. Therefore, each team needs to follow the same fundamental measurement rules.
Create a documented progress measurement procedure that defines:
- Measurement methods for each work type.
- Required evidence for reported progress.
- Progress cut-off dates.
- Responsibility for collecting and approving measurements.
- Rules for incomplete or partially completed work.
- Treatment of rework, rejected work, and changes.
Consequently, teams can compare progress across work packages without repeatedly debating how each percentage was calculated.
Control subjective progress claims
Some project activities cannot rely entirely on physical quantities. Design, engineering, management, commissioning, and other knowledge-based work may require milestone or weighted measurement.
However, subjective percentages can create significant reporting risk. A team may report 80% completion even though the remaining 20% contains critical approvals or complex work.
Therefore, divide such activities into clear, measurable components. Assign progress only when teams achieve defined evidence-based milestones.
This method reduces the risk of front-loaded progress and provides a more realistic view of remaining work.
Validate reported progress
Progress validation should form part of the regular reporting cycle. Project controls teams should challenge unusual movements rather than accept every submitted percentage.
Compare reported progress with:
- Actual installed quantities.
- Schedule activity status.
- Labour and equipment usage.
- Procurement and material status.
- Inspection and acceptance records.
- Site observations and photographs.
If the reported percentage conflicts with available evidence, investigate the difference before including it in the performance report.
Protect the integrity of earned value
Consistent progress measurement becomes particularly important when the project uses earned value management. Earned Value represents the budgeted value of work actually performed.
Therefore, unreliable progress can directly affect EV, CPI, SPI, and other performance indicators.
For example, overstated progress can increase earned value without a corresponding increase in physical achievement. The resulting performance indicators may then appear stronger than the actual project position.
Reliable measurement therefore protects the credibility of the entire monitoring system.
Create a repeatable measurement cycle
Standardization should not remain a one-time procedure. Apply the same measurement rules during every reporting period and review them when project conditions change.
Track recurring disputes, measurement adjustments, rejected progress claims, and unusual reporting patterns. These signals can reveal weaknesses in the measurement process.
As a result, the project can improve measurement quality while maintaining consistency across reporting periods.
Once teams establish a common and validated progress measurement process, they have a dependable basis for comparing physical achievement with cost and schedule performance.
That foundation naturally leads to Step 3: Integrate Cost and Schedule Data. The next step connects the measured progress with financial and schedule information to create one integrated performance view.
Step 3 — Integrate Cost and Schedule Data
Once the project establishes consistent progress measurement, the next step is to connect that progress with cost and schedule information. This integration creates a clearer view of Project Cost and Schedule performance.
Without integration, each function may report accurate information while management still struggles to understand the overall project position.
Create a common project structure
Start by establishing common identifiers across the cost and schedule systems. The WBS should provide the primary structure wherever practical.
Map activities, control accounts, work packages, cost accounts, commitments, and budgets to the same project structure.
This alignment allows teams to connect planned work, actual progress, earned value, and actual expenditure at meaningful control levels.
For example, a construction work package should connect its scheduled activities with its approved budget and corresponding cost transactions.
Align cost and schedule calendars
Cost and schedule systems must also use compatible reporting periods. Otherwise, teams may compare information that represents different time points.
Define a common data date, reporting cut-off, accounting period, and update frequency.
For example, if the schedule reflects progress through 31 August while actual costs only include transactions through 25 August, the comparison will contain a timing mismatch.
Therefore, establish clear cut-off rules before calculating performance indicators.
Connect planned value with the schedule
Time-phased budget information should connect directly with the schedule baseline. This connection allows the team to determine how much work and budget the project planned to accomplish by a specific date.
Planned Value (PV) represents the budgeted value of work scheduled for completion during the measurement period.
When teams align PV with the schedule, they gain a stronger basis for comparing planned performance with actual achievement.
This also helps identify whether a project has fallen behind its planned production curve.
Connect physical progress with earned value
The progress measurement method established in Step 2 now becomes important. Use validated physical progress to calculate the earned value associated with completed work.
Earned Value (EV) represents the budgeted value of work actually performed.
For example, if a work package has a budget of ₹10 million and the validated progress equals 40%, its earned value would represent ₹4 million under an appropriate proportional measurement method.
The measurement method must match the work package and approved project-controls methodology.
Connect actual cost with completed work
Actual Cost (AC) provides the financial view of work performed. However, the team should not interpret AC in isolation.
Compare actual expenditure with the value of work achieved. This comparison helps determine whether the project spends more or less than the value generated by completed work.
For example, spending 60% of a work package budget does not automatically indicate 60% completion.
If validated progress shows only 45% completion, the project may face an emerging cost-performance problem.
Therefore, cost must connect with physical achievement, not simply with expenditure.
Use integrated performance indicators
Once PV, EV, and AC align, the project can calculate meaningful earned value indicators.
- Cost Variance (CV): EV minus AC.
- Schedule Variance (SV): EV minus PV.
- Cost Performance Index (CPI): EV divided by AC.
- Schedule Performance Index (SPI): EV divided by PV.
These indicators provide useful signals. However, they should support deeper analysis rather than replace it.
A declining CPI may indicate cost pressure, while a declining SPI may indicate schedule performance deterioration. The team still needs to determine what drives those changes.
Reconcile different information sources
Integration does not mean simply importing data from multiple systems. The project controls team must verify that the information agrees across sources.
Reconcile cost reports with the accounting system, schedule updates with approved progress records, and commitments with procurement information.
Investigate material differences before publishing performance results.
Useful reconciliation checks include:
- Budget totals versus the approved baseline.
- Actual costs versus accounting records.
- Progress percentages versus physical evidence.
- Schedule status versus field progress.
- Commitments versus procurement records.
- Approved changes versus current baseline values.
As a result, integration becomes a controlled process rather than a simple data transfer exercise.
Avoid false precision
Integrated dashboards can create an impression of accuracy. However, precise numbers do not guarantee reliable information.
If progress data contains unsupported estimates or cost transactions remain incomplete, the resulting CPI or SPI may still misrepresent actual performance.
Therefore, document important data limitations, assumptions, exclusions, and reconciliation issues.
Management should understand both the performance result and the confidence level behind it.
Build one integrated performance view
The ultimate objective is not to create another dashboard. Instead, create a reliable view that connects planned work, achieved work, expenditure, and schedule performance.
A useful integrated view should help answer:
- What did we plan to accomplish?
- What have we actually achieved?
- What did we spend?
- Are cost and schedule performance moving together?
- Where do the largest differences exist?
Once the project establishes this integrated view, the team can move beyond isolated reporting and examine performance movement over time.
This naturally leads to Step 4: Monitor Performance and Trends. The next step focuses on detecting meaningful changes early instead of reviewing individual performance figures in isolation.
Step 4 — Monitor Performance and Trends
After integrating cost, schedule, and progress information, the next step is to monitor how project performance changes over time. A single reporting period rarely explains the complete project position.
Effective Project Cost and Schedule monitoring therefore combines current results, historical trends, leading indicators, milestones, productivity, and forecast movement.
Track current performance against the baseline
Begin each reporting cycle by comparing actual performance with the approved baseline. Review planned progress, earned progress, actual cost, and scheduled dates for the current period.
However, avoid relying only on the overall project position. A project can remain close to its baseline while individual work packages experience serious deterioration.
Therefore, review performance at appropriate levels such as project, phase, control account, work package, discipline, and major contractor.
Monitor trends instead of isolated results
A single CPI, SPI, cost variance, or schedule variance provides limited context. Instead, compare results across several reporting periods to identify the direction of performance.
For example, a CPI of 0.98 may not immediately indicate a major concern. However, a movement from 1.05 to 1.02 and then to 0.98 can signal worsening cost efficiency.
Similarly, repeated schedule deterioration can indicate a developing problem even when the cumulative project position still appears acceptable.
Trend analysis turns individual measurements into an early-warning mechanism.
Separate recent performance from cumulative performance
Cumulative indicators help management understand the overall project position. However, they can hide recent deterioration when strong earlier performance offsets current problems.
Therefore, review both cumulative and period-specific results. Compare the current period with the previous period and examine the direction of change.
Useful comparisons include:
- Current period versus previous period.
- Current performance versus baseline.
- Cumulative performance versus recent performance.
- Actual productivity versus planned productivity.
- Current forecast versus previous forecast.
This approach helps the team detect changes before they become embedded in the cumulative results.
Monitor schedule health indicators
Schedule monitoring should extend beyond planned and actual completion dates. Review the indicators that can reveal emerging pressure on future work.
Depending on the project, monitor critical path movement, total float, near-critical activities, milestone slippage, constraint changes, open logic issues, and remaining durations.
Pay particular attention to activities that repeatedly move forward without a clear recovery plan.
For example, declining float across several reporting periods can provide an earlier warning than a missed contractual milestone.
Monitor cost efficiency and productivity
Cost monitoring should also examine the relationship between expenditure and physical output. Rising expenditure does not automatically indicate poor performance.
Instead, compare actual resources and costs with the work achieved. Review labour productivity, material consumption, equipment utilization, subcontract performance, and unit costs where appropriate.
For example, higher labour cost may reflect accelerated work rather than inefficiency. Conversely, normal expenditure with declining output can indicate hidden productivity problems.
Therefore, cost trends need operational context before management decides whether corrective action is necessary.
Track leading indicators
Effective monitoring combines lagging performance measures with indicators that can reveal future exposure. This approach helps teams act before major variances appear.
Depending on the project, useful leading indicators can include:
- Design deliverables awaiting approval.
- Long-lead procurement items.
- Pending variations and change requests.
- Resource shortages and productivity declines.
- Critical permits and access requirements.
- Emerging risks and unresolved issues.
- Declining float on critical or near-critical activities.
These indicators provide additional context for cost and schedule results. Consequently, teams can investigate potential problems before they create significant impacts.
Set meaningful thresholds
Not every variance requires management intervention. Teams need clear thresholds that distinguish normal variation from conditions requiring investigation.
Define thresholds for cost variance, schedule variance, CPI, SPI, milestone movement, productivity, float erosion, and forecast changes where appropriate.
However, avoid using thresholds mechanically. A small variance on a critical milestone may matter more than a larger variance on non-critical work.
Therefore, consider magnitude, trend, criticality, duration, exposure, and potential impact when deciding whether to escalate an issue.
Use visual trends that support decisions
Dashboards and charts can make performance changes easier to identify. However, visual reporting should support analysis rather than simply display more information.
Useful visualizations may include trend lines, S-curves, milestone movement, variance charts, productivity trends, and forecast movement.
Keep the presentation focused. A useful dashboard should quickly show what changed, where it changed, and whether the change requires action.
Then provide supporting details for managers who need deeper analysis.
Challenge unexpected movements
Unexpected performance changes require investigation before the team accepts them as genuine project conditions.
For example, a sudden improvement in progress may result from a genuine productivity increase. However, it could also result from late data entry, revised quantities, or a change in measurement methodology.
Similarly, a sudden cost increase may reflect genuine expenditure, delayed invoice processing, accrual adjustments, or incorrect coding.
Therefore, validate unusual movements against supporting project evidence.
Create an early-warning routine
Make trend monitoring part of the regular project-controls cycle. Do not wait until the monthly report reaches management before investigating deterioration.
During each update, identify new adverse trends, worsening indicators, emerging risks, and changes in forecast position.
Then classify each significant movement according to its likely importance and urgency.
This routine helps the team move from reporting what happened toward recognizing what may happen next.
Move from trends to causes
Trend monitoring tells the team where performance is changing. However, it does not explain why the change occurred.
A declining CPI may result from productivity, rates, quantities, scope changes, procurement conditions, or other factors. Likewise, schedule deterioration may have several interacting causes.
Therefore, the next stage requires structured investigation rather than further monitoring alone.
This naturally leads to Step 5: Analyze Variances and Root Causes. The team can then determine why significant performance changes occurred and whether those causes will continue affecting the project.
Step 5 — Analyze Variances and Root Causes
Trend monitoring shows where project performance changes. However, it does not explain why those changes occurred. Therefore, the next step is to investigate significant variances and identify their underlying causes.
Effective Project Cost and Schedule monitoring should move beyond reporting numbers. The analysis should explain what changed, why it changed, whether the condition will continue, and what impact it may create.
Start with the size and direction of the variance
Begin by identifying significant differences between planned and actual performance. Review cost variance, schedule variance, CPI, SPI, milestone movement, productivity, and other relevant indicators.
However, do not investigate every small difference with the same level of effort. Focus attention on material, recurring, worsening, or strategically important variances.
Consider both the size of the variance and its potential impact on remaining work.
Separate symptoms from causes
A variance usually represents a symptom rather than the actual problem. For example, a cost overrun may show that expenditure exceeded earned value.
However, the underlying cause could involve low productivity, material price increases, rework, quantity growth, overtime, procurement delays, or scope changes.
Similarly, schedule slippage may result from design delays, resource shortages, access restrictions, procurement problems, poor sequencing, or productivity losses.
Therefore, ask “Why did this happen?” instead of stopping at “What is the variance?”
Break the variance into meaningful categories
Organize the investigation so the team can examine different cost and schedule drivers systematically. The categories should reflect the project’s nature and control structure.
Useful categories include:
- Scope: Changes, additions, omissions, or unclear requirements.
- Productivity: Lower output or higher resource consumption.
- Resources: Labour, equipment, skills, or availability issues.
- Procurement: Price changes, delays, shortages, or supplier performance.
- Engineering: Design changes, late information, or technical issues.
- Execution: Rework, sequencing, access, or construction constraints.
- Commercial: Claims, variations, contractual issues, or payment conditions.
- External factors: Regulatory, market, weather, or other external conditions.
This structure prevents the team from attributing every variance to generic explanations such as “site conditions” or “contractor performance.”
Use evidence to test the explanation
Root-cause analysis should rely on evidence rather than assumptions. Compare the reported variance with supporting project information before accepting an explanation.
Depending on the issue, review:
- Schedule activity records and update history.
- Actual quantities and productivity records.
- Labour and equipment reports.
- Purchase orders and supplier information.
- Approved and pending changes.
- Design and engineering deliverables.
- Site records and inspection information.
- Cost transactions, commitments, and accruals.
Consequently, the team can distinguish a genuine performance problem from a data or reporting issue.
Apply structured root-cause techniques
Use a structured method when a variance requires deeper investigation. The appropriate technique depends on the complexity and importance of the problem.
For straightforward problems, the Five Whys method can help move from the visible symptom toward an underlying cause.
For complex problems, a cause-and-effect analysis can help teams examine several contributing factors across people, processes, materials, equipment, methods, and external conditions.
The objective is not to produce a complicated diagram. Instead, identify the causes that the project can verify and address.
Distinguish one-time and recurring causes
Not every variance will continue affecting the project. Therefore, determine whether each cause represents a one-time event, a temporary condition, or an ongoing performance problem.
For example, a one-time equipment failure may increase cost during one period. However, repeated equipment breakdowns may indicate a maintenance or resource-planning problem.
Similarly, one delayed delivery may require recovery action, while repeated supplier delays may require a broader procurement response.
The future impact matters as much as the historical variance.
Separate controllable and external causes
Teams should also distinguish causes they can directly influence from conditions outside their immediate control.
For example, poor work sequencing may require an internal planning response. However, a regulatory approval delay may require stakeholder escalation and revised planning assumptions.
This distinction helps management choose realistic responses instead of assigning actions that cannot address the actual cause.
Nevertheless, external causes still require active management. The project team should assess their impact, monitor developments, and incorporate realistic assumptions into the forecast.
Assess the impact on remaining work
After identifying a cause, determine whether it affects only completed work or also threatens future performance.
Ask whether the same productivity level, resource constraint, price condition, delay, or execution problem will continue during the remaining work.
Then assess potential effects on:
- Remaining cost.
- Remaining duration.
- Critical milestones.
- Resource requirements.
- Procurement commitments.
- Project risks and opportunities.
This step transforms historical variance analysis into forward-looking project control.
Document the analysis clearly
Record the variance, cause, evidence, impact, responsible owner, and recommended response. Keep the explanation specific enough for another project professional to understand the reasoning.
A useful variance narrative should answer four questions:
- What changed?
- Why did it change?
- Will the cause continue?
- What impact could it have?
Avoid vague explanations such as “monitor closely” or “contractor to improve.” Those statements do not identify a measurable response.
Prioritize the causes that matter most
Complex projects can generate many contributing factors. However, management attention remains limited.
Therefore, prioritize causes according to their financial impact, schedule impact, recurrence, criticality, controllability, and potential future exposure.
Focus first on causes that can materially affect major milestones, remaining cost, contractual commitments, or project objectives.
This approach helps the team concentrate corrective effort where it can produce the greatest benefit.
Turn root causes into action
Root-cause analysis has limited value if the project does nothing with the findings. The analysis should therefore produce clear recommendations for management and responsible teams.
For each significant cause, define the required response, accountable owner, target date, expected outcome, and measurement method.
The purpose of variance analysis is not to explain the past alone. It is to improve decisions about the remaining work.
Once the project understands the causes and their potential future impact, it can determine which responses will improve performance.
This naturally leads to Step 6: Take Corrective Action. The next step converts verified root causes into targeted actions, measurable outcomes, and controlled recovery.
Step 6 — Take Corrective Action
Root-cause analysis identifies why performance changed. However, analysis alone cannot recover project performance. The next step is to convert verified causes into targeted corrective action.
Effective corrective action should address the actual cause, protect critical objectives, assign clear ownership, and produce measurable improvement. It should also consider both cost and schedule consequences.
Define the required outcome
Start by defining what the project needs to improve. Avoid creating actions simply because a variance appears in the monthly report.
For example, the required outcome may involve recovering a milestone, improving labour productivity, reducing material waste, resolving a procurement constraint, or controlling forecast cost growth.
State the outcome in measurable terms wherever possible. A clear outcome gives the corrective action a specific purpose.
Match the action to the root cause
The corrective action should address the cause identified during Step 5. Otherwise, the project may treat the symptom without changing the underlying condition.
For example, adding overtime may temporarily increase output. However, overtime will not solve a recurring design-release problem that prevents crews from accessing planned work.
Similarly, increasing resources may not improve productivity when poor sequencing creates repeated work interruptions.
Therefore, challenge whether the proposed action can actually influence the identified cause.
Prioritize critical problems
Not every variance deserves the same level of intervention. Prioritize actions according to their potential effect on project objectives.
Consider:
- Cost impact: Could the issue materially increase final project cost?
- Schedule impact: Could it affect critical milestones or completion?
- Criticality: Does the issue affect critical or near-critical work?
- Recurrence: Does the problem continue across reporting periods?
- Exposure: Could the condition create additional future risks?
This prioritization helps management focus limited resources on actions that can materially improve the project position.
Choose the right type of intervention
Corrective action can take different forms. The appropriate response depends on the cause, urgency, authority, and remaining project conditions.
Possible interventions include:
- Resequencing activities to remove execution bottlenecks.
- Reallocating resources to critical work.
- Improving productivity through revised methods.
- Expediting critical procurement.
- Resolving design or approval constraints.
- Reducing rework through quality interventions.
- Negotiating supplier or subcontractor recovery measures.
- Revising execution strategies when existing methods no longer remain practical.
However, do not select an action simply because it produces a rapid visible response. Consider its cost, feasibility, risks, and effect on other project activities.
Protect the critical path
Schedule corrective action should consider network logic rather than focus only on delayed activities. A delayed activity may have available float, while another activity may threaten the project completion date.
Review critical path, near-critical activities, float, predecessor relationships, resource constraints, and milestone dependencies before changing the execution plan.
For example, accelerating one activity may create congestion or increase costs without improving the final completion date.
Therefore, evaluate the entire schedule response before committing resources.
Evaluate cost before approving recovery
Schedule recovery can increase project cost. Overtime, additional shifts, extra equipment, expedited procurement, and additional supervision can all create financial consequences.
Therefore, compare the cost of recovery with the value of the schedule benefit.
For example, accelerating a critical activity may protect a contractual milestone. However, management should understand the additional cost and confirm that the expected benefit justifies the expenditure.
This prevents schedule recovery from creating an uncontrolled cost problem.
Assign clear ownership
Every significant corrective action should have one accountable owner. A group name alone does not create accountability.
Define:
- Action: What exactly must happen?
- Owner: Who remains accountable?
- Due date: When should the action produce results?
- Measure: How will the team confirm improvement?
- Escalation: What happens if the action fails?
This structure turns corrective action into a controlled management process rather than an informal commitment.
Build actions into the project plan
Important recovery actions should appear in the appropriate project-control mechanisms. Do not track critical actions only through meeting minutes or email exchanges.
Where appropriate, incorporate actions into the schedule, action register, risk register, change process, procurement plan, or recovery plan.
This creates visibility and allows the team to track whether the action progresses as planned.
A corrective action should become part of project execution, not remain outside it.
Measure whether the action works
Do not close a corrective action simply because someone completed the assigned task. Confirm whether the action actually improved project performance.
For example, a contractor may add resources to a work package. The project team should then check whether productivity improved and whether the schedule actually recovered.
Useful measures may include:
- Improved productivity.
- Reduced variance.
- Improved float position.
- Recovered milestone dates.
- Reduced forecast exposure.
- Improved cost efficiency.
This distinction separates action completion from performance improvement.
Monitor unintended consequences
A corrective action can solve one problem while creating another. Therefore, review its wider impact after implementation.
For example, additional overtime may recover schedule performance but increase labour costs and fatigue-related productivity or safety risks.
Similarly, resequencing work may protect one milestone while creating congestion for another discipline.
Consequently, evaluate corrective actions across cost, schedule, resources, quality, risk, and operational constraints.
Escalate when recovery fails
Not every corrective action will produce the expected result. When performance continues to deteriorate, management needs to know quickly.
Define escalation triggers before implementing major actions. These triggers may include continued milestone slippage, worsening productivity, additional forecast growth, or failure to remove a critical constraint.
Early escalation gives management more options. Delayed escalation can reduce the remaining recovery opportunities and increase the eventual cost of intervention.
Update the performance outlook
After implementing corrective action, update the project outlook using the latest evidence. Do not assume that the original forecast remains valid.
Assess whether the action changes remaining productivity, duration, resource requirements, procurement conditions, or other assumptions.
Then determine whether the expected completion date and final cost require adjustment.
This creates a direct connection between performance analysis, corrective action, and forecasting.
Once corrective actions are implemented and their effects become measurable, the project gains better information about its future position.
This naturally leads to Step 7: Forecast, Learn and Improve. The final step uses the latest performance evidence to refine the project outlook, measure forecasting accuracy, capture lessons, and strengthen the monitoring process for the remaining delivery period.
Step 7 — Forecast, Learn and Improve
Corrective actions can change the project’s future performance. Therefore, the final step is to update the outlook using the latest evidence and strengthen the monitoring process through continuous learning.
A reliable Project Cost and Schedule process should not end with the monthly performance report. It should continually improve the project’s understanding of its expected final outcome.
Update the cost forecast
Start by reassessing the expected final project cost using the latest actual costs, commitments, progress, approved changes, remaining quantities, productivity, and identified risks.
The forecast should reflect current project conditions rather than simply extend the original budget.
Where appropriate, calculate the Estimate at Completion (EAC) using a method that matches the project’s circumstances and the reliability of available information.
For example, recent cost performance may provide useful evidence for some work packages. However, a detailed bottom-up estimate may provide stronger information when remaining work differs significantly from completed work.
Update the schedule forecast
Review the expected completion dates using the latest schedule status, remaining durations, critical path, float, constraints, productivity, and recovery actions.
Do not treat the current baseline date as the expected completion date when actual performance indicates otherwise.
Instead, distinguish clearly between the approved baseline, current forecast, and management target.
This distinction helps management understand whether the project expects to meet its contractual or approved completion date.
Reassess the remaining work
Forecast reliability depends heavily on the quality of the remaining-work assessment. Therefore, review the work that still needs completion rather than relying only on historical performance.
Consider:
- Remaining quantities and scope.
- Current productivity rates.
- Outstanding procurement.
- Pending engineering information.
- Resource availability.
- Outstanding changes and claims.
- Known risks and opportunities.
- Required testing, commissioning, and closeout work.
This review can reveal exposures that historical performance indicators alone cannot identify.
Challenge the forecast assumptions
Every forecast depends on assumptions. Therefore, make those assumptions visible and test whether they remain realistic.
For example, a forecast may assume that productivity will improve after additional resources arrive. The team should verify whether those resources are available and whether the proposed improvement has supporting evidence.
Similarly, a schedule forecast may assume that a delayed approval will arrive within a specific period.
A forecast becomes stronger when its assumptions remain visible, measurable, and challengeable.
Compare forecast movement
Do not review the forecast only as a single final number. Track how the forecast changes between reporting periods.
Compare the current forecast with:
- The previous forecast.
- The approved baseline.
- The latest actual performance.
- The expected impact of corrective actions.
- The current risk and opportunity position.
Then investigate significant forecast movement. A large change may indicate a genuine project development, a revised assumption, improved information, or a data-quality issue.
Consequently, forecast movement itself becomes a useful monitoring indicator.
Use scenarios for significant uncertainty
Some projects contain substantial uncertainty around cost or completion. In such situations, a single forecast can create false confidence.
Develop realistic scenarios when the decision context requires them.
- Base case: The most supportable outcome using current evidence.
- Upside case: An outcome that depends on successful improvements or opportunities.
- Downside case: An outcome that includes credible adverse conditions.
Use scenarios to support decisions, not to create arbitrary ranges. Each scenario should have clear assumptions and identifiable drivers.
Measure forecast accuracy
A project can improve forecasting only when it measures how accurately previous forecasts predicted actual outcomes.
Compare earlier cost and schedule forecasts with subsequent actual results. Then identify recurring differences and investigate their causes.
For example, repeated underestimation of procurement costs may indicate weak estimating assumptions. Repeated schedule optimism may indicate unrealistic productivity or insufficient allowance for approvals.
Track useful measures such as:
- Forecast versus actual final cost.
- Forecast completion date versus actual completion.
- Forecast movement between reporting periods.
- Accuracy of major work-package forecasts.
This turns forecasting from a reporting activity into a measurable project-controls capability.
Capture lessons from performance
Use actual project experience to improve future monitoring. Do not wait until project closeout to capture every lesson.
Record recurring causes of cost and schedule variance, ineffective corrective actions, successful recovery techniques, data-quality problems, and forecasting assumptions that repeatedly failed.
Then convert useful lessons into practical changes to procedures, templates, measurement rules, reporting structures, or forecasting methods.
A lesson only creates value when the project changes its future behaviour.
Improve the monitoring process
Review whether the monitoring system itself provides the information management needs. Ask whether reports arrive on time and whether teams can explain significant movements.
Also examine whether the project spends too much effort collecting information that does not support decisions.
Improve areas such as:
- Data collection and validation.
- Progress measurement procedures.
- Cost and schedule integration.
- Variance thresholds.
- Forecasting methods.
- Dashboard and report design.
- Corrective-action tracking.
As a result, the project controls process becomes more efficient and more useful as delivery progresses.
Close the monitoring feedback loop
The seven-step process should operate as a continuous cycle rather than a sequence that ends after one reporting period.
Updated forecasts influence project management decisions. Those decisions create corrective actions. Their results then generate new performance information.
The project should feed that information back into the next monitoring cycle.
This creates a practical loop:
- Baseline establishes the expected position.
- Measurement establishes actual achievement.
- Integration connects cost, schedule, and progress.
- Monitoring identifies performance movement.
- Analysis identifies causes and future exposure.
- Corrective action addresses significant problems.
- Forecasting and learning updates the outlook and improves the process.
Therefore, effective Project Cost and Schedule monitoring becomes a continuous management system rather than a monthly reporting exercise.
The objective is not simply to produce accurate numbers. The objective is to provide early visibility, reliable forecasts, clear accountability, and actionable information while the project still has time to influence its final outcome.
Practical Example
Putting the Approach Into Practice
Consider a commercial building project in India with a planned completion date of December 2026 and an approved budget of ₹120 crore.
By the end of June 2026, management notices that physical progress appears reasonable. However, project costs have increased and several key milestones have started moving.
The project controls team applies the seven-step approach to determine what is happening, why it is happening, and what the team should do next.
The problem
The project baseline expected the structure and major MEP works to progress steadily through June. Instead, several activities have fallen behind.
At the same time, actual expenditure has increased because the contractor has used additional labour and equipment to maintain production.
The initial management concern is simple:
“Are we only experiencing a temporary variance, or will the current performance affect the final cost and completion date?”
The project team therefore starts the seven-step monitoring process.
Step 1 — Establish the baseline
The project controls team first confirms the approved scope, schedule, and cost baseline.
The review shows that the project has a time-phased budget of ₹120 crore. The baseline also identifies major structural, architectural, MEP, testing, and commissioning milestones.
The team then checks the schedule logic and confirms that the affected MEP activities connect to several important commissioning milestones.
This finding matters because the delay does not affect an isolated activity. It could influence several downstream activities.
The team therefore establishes the baseline as the reference point for the investigation.
Step 2 — Standardize progress measurement
The team then validates the reported progress. The contractor has reported 72% completion for the MEP package.
However, the project controls team does not accept the percentage without supporting evidence.
It reviews installed quantities, inspection records, approved work, procurement status, and remaining activities.
The review finds that only 65% of the measurable MEP work has actually reached the required completion stage.
The team therefore replaces the unsupported progress figure with a validated measurement.
This changes the project’s apparent performance position.
Step 3 — Integrate cost and schedule data
The team now connects the validated progress with cost and schedule information.
For the MEP work package, the approved budget equals ₹20 crore. Based on the validated 65% achievement, the earned value equals approximately ₹13 crore.
However, actual cost has already reached ₹15 crore.
The team therefore identifies a cost efficiency concern because the project has spent more than the budgeted value of the work achieved.
The schedule analysis also shows that several MEP activities have lost float and now threaten commissioning milestones.
The integrated view reveals a stronger signal than either the cost report or schedule report could provide separately.
Step 4 — Monitor performance and trends
The team reviews performance across the previous four reporting periods.
The analysis shows that MEP productivity has declined gradually. The package also moved from positive float to near-critical status during the same period.
Management initially viewed the June variance as a short-term issue. However, the trend demonstrates that the problem has continued for several weeks.
The team also identifies increasing labour hours without a corresponding increase in completed work.
The trend therefore provides an early warning that the current execution approach may not recover naturally.
Step 5 — Analyze variances and root causes
The project team investigates the reasons behind the declining performance.
It reviews site records, engineering information, procurement records, labour reports, and schedule updates.
The analysis identifies three connected causes:
- Late design information interrupted planned MEP installation.
- Incomplete work fronts caused crews to move between areas.
- Low productivity increased labour hours and installation cost.
The team then determines that these conditions will affect the remaining work if they continue.
The problem therefore extends beyond historical cost variance. It creates a future cost and schedule exposure.
Step 6 — Take corrective action
The project manager and project controls team develop a targeted recovery plan.
First, the engineering team prioritizes the outstanding MEP design information required for critical work fronts.
Next, the construction team resequences installation activities so crews can work continuously in available areas.
The contractor also reallocates experienced labour to the most critical work packages.
However, the team does not simply add more resources. It evaluates the additional cost against the expected schedule benefit.
Each action receives an accountable owner, target date, and measurable performance requirement.
The project controls team then tracks whether productivity and milestone performance actually improve.
Step 7 — Forecast, learn and improve
After implementing the recovery actions, the team updates the cost and schedule forecasts.
The original December completion date no longer represents the most realistic forecast. However, the recovery plan can reduce the expected delay if the identified actions achieve their targets.
The team therefore develops a revised forecast based on current productivity, remaining quantities, procurement status, and recovery performance.
The cost forecast also changes because additional recovery resources will increase expenditure.
Management now receives a more realistic picture:
- Current problem: MEP productivity and work-front availability have deteriorated.
- Root causes: Design information, work-front restrictions, and productivity issues.
- Corrective action: Prioritized design release, resequencing, and targeted resource allocation.
- Cost impact: Recovery actions increase the expected final cost.
- Schedule impact: Recovery actions aim to protect the commissioning milestones.
- Forecast confidence: The team will reassess the forecast as recovery performance produces new evidence.
What changed after applying the seven steps?
Before the analysis, management saw a project that appeared broadly on track but showed increasing cost and schedule pressure.
After applying the seven steps, the team identified the actual performance gap, validated the progress position, connected cost with schedule, identified the trend, established root causes, and implemented targeted actions.
More importantly, management gained a forward-looking view instead of receiving another historical status report.
The project team can now monitor whether the recovery actions improve productivity and protect critical milestones.
If performance improves, the forecast can reflect the new evidence. If performance continues to deteriorate, management can escalate the response before the exposure becomes larger.
This is the practical value of integrated Project Cost and Schedule monitoring: the process connects reliable information with analysis, action, and forecasting before the project reaches a point where recovery options become limited.
Common Mistakes to Avoid
Effective Project Cost and Schedule monitoring depends on more than collecting data and producing regular reports. Small weaknesses in measurement, analysis, communication, or follow-up can gradually reduce the value of project controls.
Therefore, project teams should identify these common mistakes early and build practical controls to prevent them from affecting decisions and project outcomes.
Monitoring Cost and Schedule Separately
When cost and schedule teams work independently, management may miss important relationships between financial and time performance. For example, schedule delays can increase labour, equipment, supervision, and overhead costs. Therefore, review cost and schedule together to understand how one performance issue can influence the other.
Relying on Reported Progress Without Validation
Reported progress may not always represent measurable physical achievement. Consequently, percentage-complete figures can create misleading performance results. Validate progress against quantities, milestones, inspections, deliverables, or other objective evidence. This approach provides a stronger basis for calculating earned value, analysing trends, and forecasting remaining work.
Comparing Actuals Only With the Original Plan
The original baseline provides an essential reference, but it cannot explain every current project condition. Therefore, compare actual performance with the approved baseline, previous forecasts, current commitments, and latest expectations. This broader comparison helps the team identify both performance deterioration and changes in the project’s future outlook.
Focusing Only on Variance Percentages
A variance percentage alone does not explain the underlying problem. For example, a small percentage on a high-value work package may create greater exposure than a large percentage on a minor activity. Therefore, consider variance magnitude, trend, criticality, recurrence, and potential future impact before deciding where management attention should go.
Treating Every Variance as a Problem
Not every variance requires corrective action. Some differences may result from timing, accounting adjustments, planned sequencing, or one-time events. Therefore, investigate significant and recurring variances first. Then determine whether the condition affects remaining work before allocating resources to corrective action.
Ignoring Trends Between Reporting Periods
A monthly report can show the current position while hiding gradual deterioration. However, repeated small changes can eventually create significant exposure. Track trends in cost efficiency, productivity, float, milestone movement, commitments, and forecast values. Consequently, the team can identify emerging problems before they become major project issues.
Using Generic Root-Cause Explanations
Statements such as “low productivity,” “site issues,” or “contractor delay” rarely provide enough information for effective action. Instead, investigate the specific conditions behind the variance. Identify what happened, why it happened, whether it will continue, and how it affects remaining work. This produces more useful corrective actions.
Taking Corrective Action Without Testing Its Impact
A recovery action can improve one performance indicator while creating pressure elsewhere. For example, additional overtime may improve schedule performance but increase labour costs. Therefore, evaluate the effect of proposed actions on cost, schedule, resources, quality, risk, and productivity before implementation.
Updating the Forecast Without Reviewing Assumptions
Forecasts depend on assumptions about productivity, quantities, procurement, resources, changes, risks, and remaining duration. However, teams sometimes carry old assumptions into new reporting periods. Review important assumptions whenever project conditions change. As a result, the forecast remains connected to current evidence rather than historical expectations.
Treating the Forecast as a Fixed Number
A forecast represents the project’s expected future position based on current information. Therefore, it should change when significant evidence changes. Track forecast movement between reporting periods and investigate major changes. This helps management understand whether performance improved, deteriorated, or simply became clearer as the project generated better information.
Closing Actions Without Measuring Results
Completing an action does not automatically mean that the problem has improved. For example, adding resources does not prove that productivity has recovered. Therefore, define measurable success criteria before implementing important actions. Then compare actual results with those criteria and escalate the issue if the expected improvement does not occur.
Producing Reports Without Driving Decisions
A project controls report should support action, not simply document historical performance. If management cannot quickly identify the major problems, causes, forecast impact, owners, and required decisions, the report provides limited value. Therefore, connect every significant issue with a clear recommendation, accountable owner, required decision, and follow-up mechanism.
Key Takeaways
Building reliable Project Cost and Schedule monitoring requires a structured process that connects baseline management, progress measurement, cost and schedule integration, performance analysis, corrective action, forecasting, and continuous improvement.
- Establish a reliable baseline. Define the approved scope, cost, schedule, measurement rules, reporting periods, and performance criteria before monitoring begins.
- Measure actual progress accurately. Use objective evidence such as quantities, milestones, deliverables, and physical progress rather than relying only on reported percentages.
- Connect cost and schedule. Analyze financial performance alongside schedule progress, productivity, milestones, and critical-path movement to understand their combined effect.
- Monitor trends, not only current status. Track recurring variances, productivity changes, forecast movement, float erosion, and milestone slippage to identify emerging problems early.
- Investigate root causes. Move beyond variance reporting and determine whether problems originate from scope, resources, procurement, engineering, productivity, execution, commercial conditions, or external factors.
- Take targeted corrective action. Match each response to the verified root cause, assign accountability, assess wider impacts, and measure whether the action produces the expected improvement.
- Continuously update the forecast. Reassess remaining cost, completion dates, risks, assumptions, and recovery performance as new project information becomes available.
- Learn from project performance. Compare forecasts with actual outcomes, identify recurring weaknesses, and improve monitoring methods, reporting processes, and forecasting assumptions.
Effective Project Cost and Schedule monitoring turns project data into insight, insight into decisions, and decisions into timely action that protects cost, schedule, performance, and project outcomes.
References
This guide draws on professional standards, government guidance, published research, and industry studies covering project cost and schedule monitoring, performance measurement, variance analysis, forecasting, corrective action, and project controls.
- Process Groups: A Practice Guide — Project Management Institute. Provides practical guidance for monitoring and controlling project performance throughout project delivery.
- Monitoring Performance Against Baseline — Project Management Institute. Supports baseline comparison, performance measurement, variance analysis, and management by exception.
- Earned Value Management and Forecasting — Project Management Institute. Examines the use of earned value information for assessing cost and schedule performance and forecasting project outcomes.
- How Do You Know the Status of Your Project? — Project Management Institute. Discusses practical approaches for establishing project status and using monitoring information to support management decisions.
- Performance Audit on Construction of Major Bridges in Madhya Pradesh — Comptroller and Auditor General of India. Examines project delays, cost escalation, planning weaknesses, and implementation issues in major infrastructure projects.
- Delay Analysis of Infrastructure Construction Projects in India — Journal of The Institution of Engineers (India): Series A. Examines delay factors affecting Indian infrastructure construction projects, including material, site, and contractor-related issues.
- Analysis and Modeling of Delays During Construction Handover Stage for Building Projects — International Journal of Building Pathology and Adaptation. Examines delay factors affecting building projects and develops an approach for estimating delay during the handover stage.
- Causes of Delay in Saudi Public Construction Projects — Alexandria Engineering Journal. Uses industry responses to identify and evaluate significant causes of delay in Saudi public construction projects.
- Cost Estimating and Assessment Guide — U.S. Government Accountability Office. Provides best practices for developing, managing, validating, and updating reliable program cost estimates.
- Schedule Assessment Guide — U.S. Government Accountability Office. Provides best practices for developing and maintaining reliable project schedules and assessing schedule risks.
- Program Planning and Control Guidance — NASA Office of the Chief Financial Officer. Covers cost estimating, schedule management, earned value management, risk management, and integrated project controls.
- Monitoring Systems and Their Effectiveness for Project Cost Control in Construction — International Journal of Project Management. Examines approaches for monitoring construction project performance and identifying deviations from planned cost.
Together, these sources provide a broad evidence base for the guide’s recommendations on Project Cost and Schedule monitoring, progress measurement, performance analysis, root-cause investigation, corrective action, forecasting, and continuous improvement.
FEATURED PROJECT CONTROLS GUIDES
Practical Guidance for Measuring, Analyzing, and Controlling Project Performance
Effective project controls requires more than collecting project data and preparing reports. Teams need to measure progress, understand cost and schedule performance, identify variances, investigate their causes, and develop realistic forecasts.
How to Set Up Effective Project Controls
Learn how to establish project controls processes, define responsibilities, set performance measures, structure reporting requirements, and create a reliable framework for project performance management.
How to Measure Project Progress Accurately
Learn how to establish reliable progress measurement methods, validate reported progress, evaluate actual performance, identify deviations, and maintain consistent project performance information.
How to Analyze Project Cost Variances
Understand how to identify project cost variances, investigate their underlying causes, assess financial impacts, evaluate trends, and determine appropriate corrective actions.
MORE PROJECT CONTROLS RESOURCE TYPES
Continue Your Project Controls Learning
Project controls knowledge becomes more valuable when you can understand performance, apply structured methods, and develop practical skills. Explore the other resources within the Project Controls collection to complement the guidance provided in these guides.
Templates
Use practical templates and checklists to establish controls, measure progress, analyze variances, develop forecasts, prepare reports, and support project performance management.
Downloads
Access useful project controls materials and reference resources to support learning and day-to-day activities involving cost, progress, forecasting, reporting, and project performance.
Career Roadmaps
Follow structured learning paths to develop project controls knowledge, practical skills, analytical capabilities, and professional competencies for project controls career development.
Case Studies
Explore project controls situations, decisions, challenges, and outcomes to understand how cost, progress, forecasting, reporting, and performance practices are applied in real projects.
Glossary
Find clear explanations of project controls, cost control, progress measurement, forecasting, performance management, reporting, and related terminology used across project environments.
Insights & Articles
Explore professional perspectives, insights, emerging practices, and discussions relevant to project controls, cost management, performance measurement, forecasting, and reporting.
Looking for more project management resources? Explore the Kleios Technologies Resources Hub to discover our complete collection of guides, templates, downloads, career roadmaps, case studies, glossary resources, and insights.
RELATED KNOWLEDGE DOMAINS
Continue Your Learning Across Related Knowledge Domains
Project Management is closely connected with specialized disciplines that support successful planning, execution, governance, performance measurement, and professional growth. Explore related knowledge domains to expand your expertise, develop complementary skills, and access practical resources across the complete project management ecosystem.
Expand your expertise one domain at a time and build a well-rounded project management skill set.
Why Explore Related Domains?
- Develop cross-functional project management expertise
- Discover specialized knowledge beyond core project management
- Access practical resources across interconnected disciplines
- Build a complete professional learning pathway
- Strengthen career readiness through continuous learning
Each knowledge domain complements your Project Management expertise, helping you build broader capabilities and solve real-world project challenges with greater confidence.
Project Management
Practical project management knowledge, practices, and professional resources.
Project Planning & Scheduling
Planning techniques, scheduling methods, and timeline management resources.
PMO
Governance, portfolio management, and organizational project excellence.
Risk Management
Risk identification, assessment, mitigation, and monitoring resources.
Primavera P6
Professional planning, scheduling, resource management, and reporting.
Microsoft Project
Project scheduling, tracking, reporting, and collaboration resources.
Power BI
Interactive dashboards, reporting, visualization, and project analytics.
PMI Certifications
Certification guidance, exam preparation, and professional development resources.