
PROJECT CONTROLS INSIGHT
When Do Progress Measurements Mislead Project Decisions?
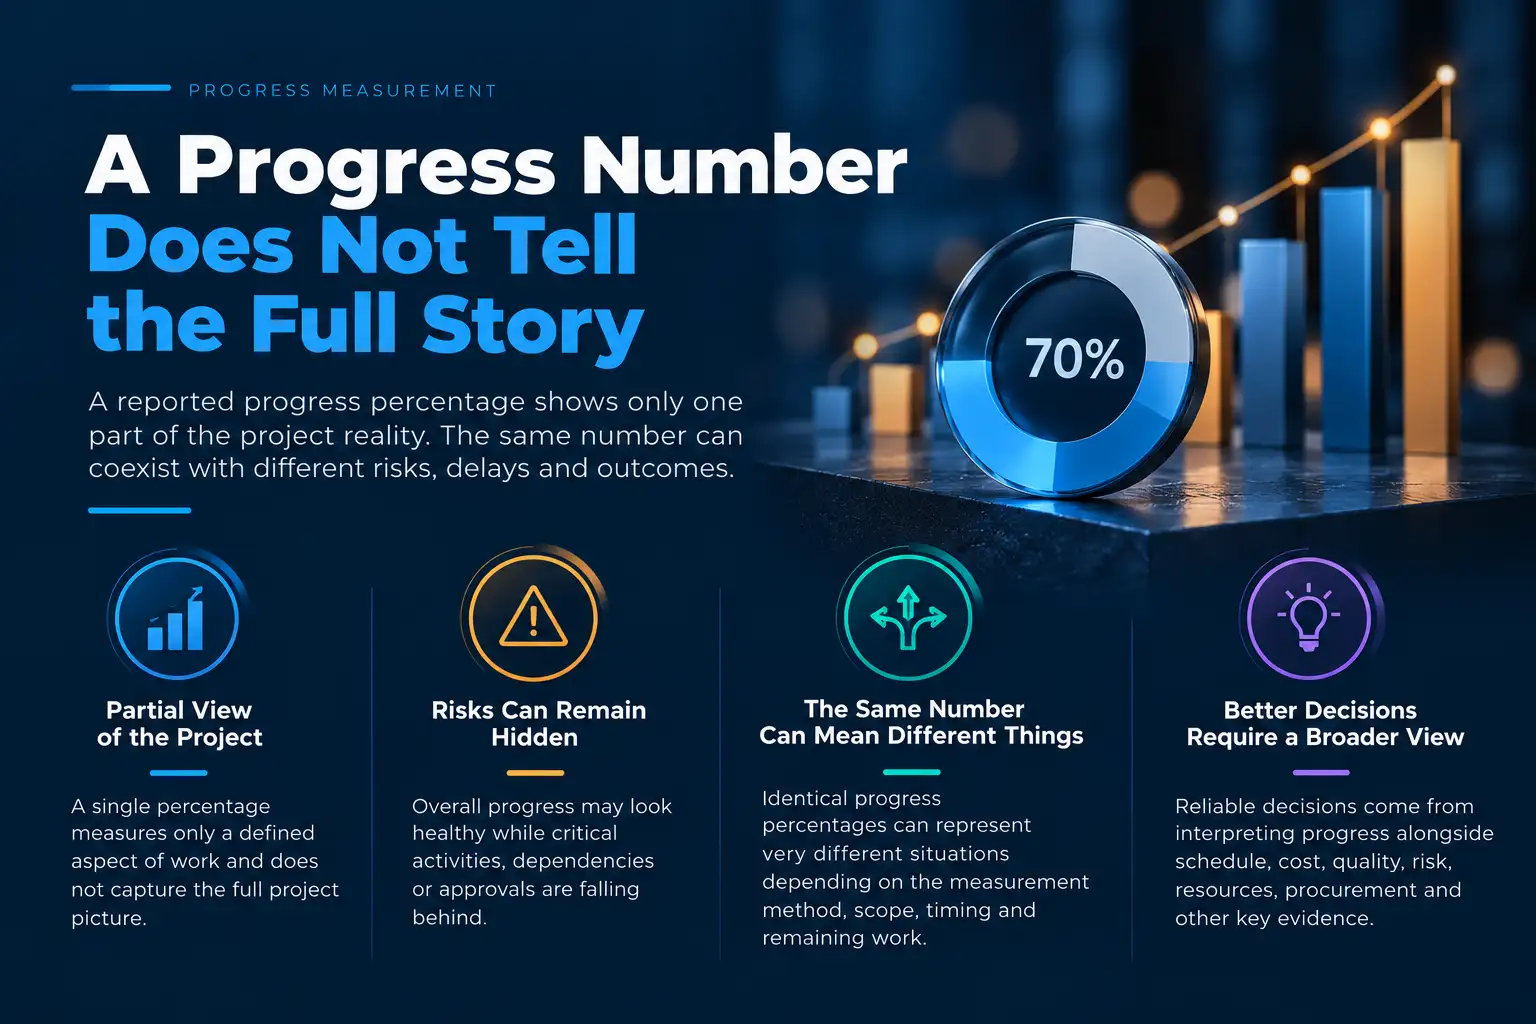
Progress Measurements Mislead when a valid progress figure is interpreted beyond what it actually represents. A project may show healthy reported progress while critical work, dependencies, approvals, quality conditions, or remaining exposure are moving in a different direction.
This Insight examines why progress measurements can create false confidence, how aggregation, measurement uncertainty, timing, and missing context can distort interpretation, and what project professionals should reconsider before turning progress signals into project decisions.
Professional Insight · Project Controls · 16–20 min read
Introduction
Progress measurements help project professionals understand how much work has been accomplished against the plan. They support reporting, forecasting, performance assessment, and management decisions. However, Progress Measurements Mislead when professionals interpret them beyond what the underlying measure can actually demonstrate.
A project can report strong overall progress while critical work remains exposed. A work package can earn progress while approvals, testing, quality, or integration remain unresolved. Similarly, a precise percentage can create confidence even when the evidence behind it contains uncertainty.
The issue is therefore not simply whether progress has been measured correctly. The more important question is whether the measurement provides the right evidence for the decision being considered. A progress figure may be valid for measuring accomplishment but insufficient for judging milestone readiness, schedule exposure, or project condition.
This Insight examines why progress measurements can create false confidence, why professionals may miss the limitations of apparently useful indicators, and how those limitations can affect decisions. It also considers what project professionals should reconsider when interpreting progress and introduces a practical lens for connecting measurement, context, evidence, and action.
The Common Assumption
Progress measurement is essential to project control. However, several common assumptions can influence how professionals interpret the numbers they receive. These assumptions often appear reasonable because the measures are established, repeatable, and easy to communicate.
The difficulty begins when a progress measure becomes a substitute for broader project understanding. Progress Measurements Mislead when professionals assume that the number represents more than the measurement method was designed to show.
A Higher Progress Percentage Means Better Project Performance
A higher progress percentage usually means more planned work has been accomplished. However, it does not automatically mean that the project’s overall condition has improved. Cost exposure, critical-path performance, quality, risk, approvals, and remaining work can move differently from reported progress.
For example, a project can reach 75% physical progress while a critical commissioning package remains substantially incomplete. The headline percentage may therefore look healthy while an important project outcome becomes more exposed. More reported progress does not necessarily mean less project risk.
One Project-Level Number Can Represent the Whole Project
Project-level indicators make reporting easier. However, aggregation can hide differences between work packages, milestones, dependencies, and critical activities. Strong progress in non-critical work can offset weaker performance in work that matters more to the next major outcome.
This does not make aggregation wrong. Instead, the level of aggregation should match the decision being made. A leadership review may need an overall view, while a milestone decision may require activity-level or critical-path evidence.
A Precise Number Must Represent Precise Evidence
A progress figure such as 82% appears highly precise. However, the number can still depend on judgement, measurement rules, available evidence, and the selected progress method. Research on progress measurement uncertainty shows that uncertainty in assessing physical progress can flow into earned-value calculations.
Therefore, numerical precision should not create unwarranted confidence. The professional question should include both “What is the reported progress?” and “How strong is the evidence behind it?”
More Frequent Measurement Means Better Control
Frequent measurement can improve timeliness, but it cannot correct a weak measurement basis. More frequent reporting may simply produce uncertain information more often when the underlying method does not represent meaningful accomplishment.
Effective control depends on relevant, timely, and sufficiently reliable evidence rather than reporting frequency alone. More data does not automatically create better project insight.
Earned Progress Automatically Represents Schedule Position
Earned-value indicators provide useful information about planned work and accomplished work. However, they do not replace schedule logic or critical-path analysis. A project can show acceptable aggregate schedule performance while an important path or milestone faces deterioration.
Schedule performance indicators therefore need appropriate context. A useful progress measure should support schedule analysis, not become a substitute for understanding the schedule.
These assumptions are understandable because progress metrics simplify complex project conditions. The real risk begins when a useful measurement becomes a complete explanation of project performance.
What Is Really Happening?
The issue is rarely that progress measurement has no value. The deeper problem is that every measurement method represents only a defined view of project accomplishment. Progress Measurements Mislead when professionals treat that view as a complete picture of project condition.
Once this distinction is understood, several less visible effects become easier to recognize. The measurement method shapes what becomes visible, aggregation can hide important exposure, and reported progress can differ from actual readiness.
The Measurement Method Shapes What Professionals See
Progress can use units completed, weighted milestones, fixed formulas, physical quantities, percent complete, or other agreed methods. Each method answers a slightly different question about accomplishment. Therefore, the method does more than calculate progress. It determines which aspects of work become visible in the performance record.
A weighted milestone method may provide strong evidence at defined accomplishment points. A physical measurement may work better for repetitive production. Level-of-effort methods can represent support work where tangible outputs are difficult to define. The appropriate method depends on the work and the evidence available.
Reported Progress Can Contain Measurement Uncertainty
A reported percentage can look precise even when its underlying evidence contains uncertainty. Percent-complete assessments may depend partly on professional judgement, especially where work does not have clear physical units or objective completion points.
Research on uncertainty in earned-value analysis shows that uncertainty in progress assessment can flow into earned-value calculations. Therefore, professionals should not assume that a precise percentage represents equally precise knowledge. The confidence placed in a measure should reflect the strength of its evidence.
Aggregation Can Hide Critical-Path Exposure
An overall progress figure combines many activities into one view. That makes management reporting easier, but it can also reduce visibility of where the exposure sits. Strong progress on non-critical work can offset weaker progress on activities that control an important milestone.
This is particularly important when professionals use project-level schedule indicators without examining schedule logic. A healthy aggregate measure does not prove that every important path remains healthy. Critical activities, interfaces, and milestone-driving work require their own context.
Work Can Earn Progress Without Fully Demonstrating the Required Outcome
Measured accomplishment does not always equal completed outcome. Design work may be reported as complete while approval remains outstanding. Equipment may be installed while testing or commissioning remains incomplete. Software may be developed while acceptance criteria remain unmet.
The progress measure may still be valid within its defined rules. However, the decision about readiness requires additional evidence. Work performed and outcome achieved are related, but they are not always the same condition.
Level of Effort Can Make Activity Look Like Progress
Some project work earns value through the passage of time because it supports other activities rather than producing a directly measurable technical output. This can be appropriate when no practical objective measure exists. However, professionals should recognize what that progress represents.
A higher contribution from level-of-effort work can influence aggregate schedule indicators without demonstrating equivalent progress toward a physical or technical outcome. The measure therefore needs context before professionals use it to judge schedule position.
The Status Date Can Separate the Number From Current Reality
A progress figure describes conditions captured at a particular status date. Yet decisions may occur days or weeks later. Delayed updates, late actuals, approval changes, or new field conditions can make a previously valid measure less useful for the current decision.
Professionals should therefore consider both what the number says and how current the evidence is. Timeliness becomes part of measurement usefulness when project conditions can change quickly.
Better Data Collection Does Not Automatically Create Better Progress Insight
Digital tools, automated reporting, reality capture, BIM, computer vision, and other technologies can improve the speed and consistency of evidence collection. However, technology does not decide what meaningful progress should represent.
More data can improve visibility when it is relevant and trustworthy. Otherwise, it can create more information without improving interpretation. The objective is not to measure more. It is to understand enough of the project condition to make a better decision.
Why Do Professionals Miss the Problem?
Professionals rarely miss a progress problem because they lack data. More often, they miss it because the available data creates a reasonable but incomplete picture. Established metrics, reporting routines, and management dashboards can make the project appear easier to interpret than it really is.
The challenge becomes more significant when Progress Measurements Mislead without appearing obviously wrong. The number may be calculated correctly, yet its limitations may remain outside the main management conversation.
Metrics Can Create False Confidence
A quantified measure feels easier to trust than incomplete or qualitative information. A progress figure of 82% appears precise, while unresolved interfaces or uncertain approvals are harder to express in one number.
That difference can influence professional attention. Teams may give greater weight to information that looks measurable, even when less quantifiable conditions could determine the next project outcome. Precision can therefore create confidence without providing complete certainty.
This does not mean professionals should distrust quantitative measures. Instead, they should recognize that a metric provides evidence within defined boundaries. The number deserves confidence for what it measures, but not automatically for everything outside those boundaries.
Aggregation Makes the Project Easier to Read — and Harder to See
Management needs concise information. Project teams therefore aggregate detailed performance into summary measures, dashboards, and status indicators. This improves communication, but the process can also remove important differences between parts of the project.
A strong result across many non-critical activities can offset weak performance in a smaller group of milestone-driving activities. The overall number may remain acceptable while the condition that matters most continues to deteriorate.
Aggregation becomes a problem when the summary becomes more visible than the underlying evidence. Professionals may then see the project clearly at a high level while missing where the actual exposure sits.
Dashboards Direct Attention Toward What They Measure
A dashboard does more than display information. It influences what people discuss, investigate, and escalate. If a dashboard emphasizes progress percentages and schedule indicators, those measures naturally receive more attention.
Meanwhile, early signals may remain outside the main view. These can include unresolved design decisions, repeated clarification requests, approval delays, resource instability, supplier dependencies, or growing rework.
Research on early warning signs shows that professionals can struggle to recognize and act on weak signals before problems become obvious. The absence of deterioration in a headline metric does not prove that the underlying project condition remains stable.
Professionals May Focus on What Is Visible Rather Than What Is Outcome-Critical
Visible work creates an intuitive sense of progress. Physical installation, completed documents, developed software, or recorded hours can provide tangible evidence that activity is moving forward.
However, the next important outcome may depend on something less visible. A completed installation may still require testing. A finished design may still need approval. A developed system may still need integration and acceptance.
Therefore, professionals should ask whether the work being reported as progress also advances the condition that matters to the next outcome. Visible activity is useful evidence, but it is not always the most important evidence.
Simplified Reporting Can Remove Important Context
Project information becomes increasingly condensed as it moves from work packages to project dashboards and management reviews. Assumptions, exceptions, uncertainty, and dependencies can disappear during that transition.
Reporting behavior can also influence what reaches decision-makers. Research into project status reporting has found relationships between reported status, organizational conditions, and subsequent project performance. However, the evidence does not support a simple conclusion that professionals deliberately hide bad news.
The more useful interpretation is that measurement, judgement, communication, and organizational context can all influence the picture presented to management.
Familiar Metrics Can Become Substitutes for Professional Judgement
Experienced professionals often work with familiar measures because they provide a common language for project performance. The risk emerges when familiarity reduces the willingness to question what the measure actually represents.
A metric should trigger interpretation rather than end it. When a progress number becomes the conclusion, professionals may stop asking what changed, why it changed, what remains exposed, and whether the evidence supports the proposed response.
The problem is therefore not a lack of professional judgement. It is the possibility that a familiar measurement can narrow where that judgement is applied. Strong project control requires professionals to look beyond the headline number when the decision carries material consequences.
What Happens If It Continues?
A misleading progress interpretation does not usually create an immediate project failure. Its greater risk comes from what happens when the same interpretation continues across reporting periods. A condition that initially appears manageable can become harder to correct as time, flexibility, and available response options decrease.
Progress Measurements Mislead most when an incomplete signal remains accepted long enough to influence repeated decisions. The consequence is therefore not simply inaccurate reporting. It is the gradual deterioration of decision quality.
Weak Signals Remain Below the Decision Threshold
Early project problems rarely arrive as one large variance. They often begin as smaller changes that appear manageable in isolation. Approval delays, unresolved interfaces, repeated rework, resource constraints, and supplier concerns may each seem insufficient to justify escalation.
The risk grows when several signals point in the same direction but remain disconnected from the main progress discussion. The project can continue reporting acceptable progress while the conditions supporting future progress become weaker.
Research on early warning signs shows that project professionals can struggle to recognize and act on weak signals before problems become more visible. The first consequence may therefore be lost visibility rather than visible failure.
Corrective Action Starts Later Than It Should
When a problem remains below the decision threshold, the project loses response time. This matters because corrective actions require time to produce results, especially when they involve procurement, approvals, technical changes, resources, or contractual decisions.
An issue identified several weeks before a milestone may still allow resequencing, additional resources, accelerated approvals, or other recovery measures. The same issue identified immediately before the milestone may leave far fewer practical options.
Delayed recognition reduces the project’s decision space. The project may still be recoverable, but recovery can become more expensive, disruptive, or difficult to execute.
Management Starts Treating Symptoms Instead of Causes
When the underlying condition finally becomes visible, management may respond to the most obvious symptom. A delayed milestone, unfavorable schedule indicator, or declining progress percentage can trigger immediate action without fully explaining why the condition developed.
For example, a delayed milestone may result from unresolved design information rather than insufficient labour. Adding resources may increase activity without removing the actual constraint. Similarly, accelerating work may create additional rework if the underlying technical issue remains unresolved.
Professionals should therefore distinguish between the indicator that reveals the problem and the condition that produces the problem. The first tells management where to investigate. The second determines what action may be effective.
Forecasts Inherit Weak or Incomplete Progress Signals
Forecasts depend on evidence about current performance and the conditions affecting remaining work. If progress data is poorly interpreted, the forecast can inherit the same limitation.
A mathematically consistent forecast can still provide weak decision support when its underlying progress signal does not represent the condition driving the outcome. This can create a false sense of confidence because the forecast appears quantitative and systematic.
The problem is not that forecasting models are inherently unreliable. Instead, forecast quality depends partly on whether the evidence entering the forecast reflects the conditions that will influence the work remaining.
Management Options Become More Expensive and More Constrained
As a project moves forward, the flexibility available to management often decreases. Float is consumed, procurement windows narrow, resources become committed, and dependencies become harder to change.
A misleading interpretation can therefore have an economic and operational consequence beyond inaccurate reporting. By the time the real condition becomes obvious, several lower-impact responses may no longer be available.
Professionals should pay particular attention to conditions that can become difficult to recover later. These can include:
- Critical-path activities with limited remaining float.
- Long-lead procurement or specialist resource dependencies.
- Approvals or technical decisions that control downstream work.
- Interfaces where delayed decisions can affect several work packages.
- Remaining work that becomes progressively harder or more expensive to recover.
The earlier professionals recognize these conditions, the more choices they usually retain.
Repeated Misinterpretation Can Normalize Deteriorating Conditions
One misleading interpretation may have limited consequences. Repeated interpretation can create a more serious pattern. Each reporting cycle can reinforce the previous conclusion, particularly when the headline progress measure remains within accepted thresholds.
For example, a team may repeatedly conclude that a critical activity will recover in the next period. Each individual forecast may appear reasonable. However, repeated slippage can gradually consume the flexibility needed to achieve the milestone.
This pattern can also influence organizational behaviour. When a condition remains classified as manageable for long enough, escalation may become harder to justify even as the underlying exposure increases.
The professional concern is therefore not simply whether one progress report was misleading. It is whether the reporting system allows small deviations to accumulate without forcing a reconsideration of the underlying project condition.
Ultimately, the consequences form a progression: weak signals remain below attention thresholds, recognition is delayed, corrective options narrow, and management increasingly responds to symptoms. The project may still recover, but the cost and difficulty of recovery can increase.
The most important consequence is the loss of decision time. A useful progress measurement should help professionals act while meaningful choices remain available, not merely confirm the problem after those choices have disappeared.
What Should Project Professionals Reconsider?
Project professionals should not respond to misleading progress by abandoning measurement. They should reconsider how progress evidence is interpreted, combined, and connected to decisions. Progress Measurements Mislead when professionals treat one valid signal as a complete representation of project condition. A stronger approach asks what the measure shows, what it excludes, and whether it supports the decision being considered.
Treat Progress as One Dimension of Project Condition
Progress is important, but it represents only one dimension of project performance. A project can achieve planned physical progress while experiencing deterioration in schedule logic, quality, risk exposure, technical readiness, procurement, or stakeholder decisions.
Therefore, a progress percentage should be interpreted alongside the conditions that determine whether the remaining work can be completed successfully. This is particularly important when the completed portion is less difficult than the remaining work. A project may report substantial progress while its most complex activities are still ahead.
Professionals should therefore ask whether reported progress is accompanied by corresponding readiness. For example, completed installation does not necessarily demonstrate commissioning readiness. Similarly, engineering progress does not necessarily demonstrate that outstanding technical decisions will not affect downstream execution.
This does not make progress measurement less valuable. Instead, it establishes its proper role. Progress Measurements Mislead when they are treated as a proxy for the entire project condition rather than as one component of a broader evidence set.
Separate Measurement Accuracy From Decision Accuracy
A measurement can be accurate and still support a poor decision. This distinction is central to interpreting project performance information. Measurement accuracy asks whether the reported figure correctly reflects the defined measurement method. Decision accuracy asks whether that figure provides sufficient evidence for the decision being made.
For example, a project may correctly calculate 78% weighted physical progress. However, that figure alone may not demonstrate that the project is 78% ready for a contractual milestone. The remaining work may include commissioning, integrated testing, approvals, system interfaces, or other activities with disproportionate influence on the outcome.
The distinction becomes even more important when professionals compare metrics across different work packages. A percentage derived from measurable installation quantities may have a different evidential basis from a percentage based on engineering deliverables, management activities, or level-of-effort work.
Professionals should therefore examine the measurement basis before drawing conclusions from the number. Useful questions include:
- What exactly earns progress?
- What evidence supports the reported value?
- Does the measurement represent accomplishment, readiness, or another condition?
- What uncertainty exists within the measurement?
- Does the decision require information that the metric does not contain?
These questions help prevent a technically correct metric from becoming an unjustified conclusion. The objective is not to distrust the number. It is to understand the boundary of what the number can legitimately support.
Match the Level of Analysis to the Decision
The appropriate level of analysis depends on the decision. A project-level progress figure may be suitable for communicating broad status. It may be insufficient, however, when management needs to understand why a contractual milestone is at risk.
At that point, professionals may need to examine the schedule logic, critical path, near-critical activities, remaining float, dependencies, interfaces, and specific work packages driving the milestone. Aggregated project progress can conceal these differences because strong performance in less critical work may offset deterioration in strategically important activities.
The same principle applies to cost and schedule indicators. A project-wide indicator can identify a developing trend, but it may not identify the work package, dependency, or decision responsible for that trend. Consequently, analysis should move to the level where management action can actually influence the condition.
This creates a practical hierarchy:
- Project level: Is the overall project condition changing?
- Control-account or work-package level: Where is the change occurring?
- Schedule and dependency level: What is driving the potential outcome?
- Activity or deliverable level: What specific condition requires intervention?
The level of analysis should therefore follow the decision rather than the convenience of the dashboard. When Progress Measurements Mislead, aggregation is often part of the reason because strategically important deterioration becomes diluted within a larger project-level number.
Do Not Equate Earned Progress With Outcome Achievement
Professionals should distinguish between work accomplishment and achievement of the intended project outcome. Earned value and other progress methods can provide structured evidence of work performed. They do not automatically establish that the resulting product, system, or deliverable is fully functional, accepted, compliant, or ready for its intended use.
This distinction becomes important when quality, testing, commissioning, integration, or acceptance conditions are significant. A deliverable can receive measurable progress while unresolved defects, incomplete interfaces, outstanding approvals, or failed tests remain capable of affecting the final outcome.
Consequently, progress reporting should be connected with the conditions that define successful completion. Depending on the project, these may include:
- Technical acceptance criteria
- Quality requirements and inspection results
- Testing and commissioning readiness
- Required approvals and decisions
- Interface and integration readiness
- Operational or contractual acceptance conditions
This broader interpretation prevents professionals from confusing “work has been performed” with “the required result has been achieved.”
Look for Conditions That Precede Progress Deterioration
Project professionals should also look beyond the progress number for conditions that may affect future performance. Reported progress is often a result of work already completed. However, many management decisions need to address conditions that will influence work not yet completed.
These leading conditions can include unresolved engineering decisions, delayed approvals, constrained resources, procurement dependencies, interface conflicts, emerging risks, incomplete prerequisites, or limited access to work fronts. Such conditions may not immediately reduce the reported progress percentage.
That makes them particularly important. If professionals wait until the progress metric visibly deteriorates, some recovery opportunities may already have been lost. Earlier attention allows teams to resolve constraints before they become measurable performance problems.
The question therefore changes from “How much progress have we made?” to “What conditions could prevent the remaining work from being completed as planned?” This shift creates a more forward-looking control conversation.
Define What “Green” Actually Means
Finally, professionals should reconsider what a green status represents. Green should mean that the project is within explicitly defined thresholds for the dimensions being assessed. It should not become a blanket statement that the project has no material exposure.
A project can be green for reported physical progress while amber for technical approvals, red for a critical dependency, or under pressure on a contractual milestone. Combining these conditions into a single colour without preserving their meaning can create false reassurance.
A stronger reporting practice makes the basis of status visible. It identifies the metric, threshold, time period, evidence, material exceptions, and decision implications. This helps management understand not only whether the project is within tolerance, but also where attention is required.
Ultimately, professionals should not ask only whether the progress number is correct. They should ask whether it is decision-relevant. Progress Measurements Mislead when a valid number receives more interpretive authority than its evidence warrants.
The practical discipline is therefore straightforward: measure carefully, understand the measurement basis, preserve critical context, examine the conditions surrounding the number, and connect evidence to the decision it can genuinely support. Progress becomes more useful when it informs professional judgement rather than replacing it.
A Practical Professional Lens
A useful progress measure should help professionals understand the project, not simply produce a status number. The following Kleios analytical lens provides a practical sequence for moving from measurement to informed action. It is not a formal PMI, ISO, AACE, or APM methodology. It is a professional interpretation framework built around the evidence and limitations identified in the research.
MEASURE — What Exactly Has Been Measured?
Start by identifying exactly what the reported progress represents. Determine the measurement basis, the evidence supporting it, the period covered, and the rules used to recognize accomplishment. Physical quantities, weighted milestones, completed activities, earned value, deliverables, and level-of-effort work do not provide identical evidence.
This distinction matters because the reliability of a progress figure depends partly on how accomplishment is defined. Objective evidence can strengthen measurement, while subjective judgement or inappropriate measurement rules can introduce uncertainty. Therefore, the first question should not be whether the percentage looks reasonable. It should be whether the percentage represents a clearly defined and defensible measure of accomplishment.
CONTEXTUALIZE — What Does the Number Leave Out?
Next, identify what the progress measure does not capture. A progress percentage normally represents a defined dimension of work accomplishment. It may not represent readiness, quality, technical acceptance, remaining risk, schedule exposure, or the difficulty of the remaining work.
For example, a project reporting 78% physical progress may appear healthy. However, the remaining 22% could include commissioning, integrated testing, critical interfaces, approvals, or contractual acceptance activities. The reported figure may therefore be correct while the project remains exposed to significant outcome risk.
Professionals should particularly examine whether the remaining work has greater importance or complexity than the completed work. This prevents Progress Measurements Mislead from becoming a conclusion that the project is broadly healthy simply because a large percentage has been earned.
CROSS-CHECK — What Other Evidence Supports or Challenges It?
A progress figure becomes more useful when it is tested against other relevant evidence. The objective is not to create additional reporting for its own sake. It is to determine whether different signals tell a consistent story.
- Compare progress with schedule logic, critical-path position, and remaining float.
- Check whether quality, testing, and acceptance conditions support the reported accomplishment.
- Review procurement, approvals, interfaces, and dependencies that could affect remaining work.
- Consider cost, risk, resource, and forecast information where relevant to the decision.
This cross-check is particularly important for aggregate indicators. A project-wide progress measure can remain strong while critical activities deteriorate. Therefore, a useful professional question is: “Does the rest of the project evidence support the story this progress number is telling?”
PRIORITIZE — Which Condition Actually Matters to the Outcome?
Not every deviation deserves the same management attention. Once the evidence has been cross-checked, identify the condition with the greatest potential effect on the project outcome.
A project may have strong overall progress while one critical interface threatens a contractual milestone. In that situation, the interface may matter more than several minor work packages showing weaker performance. The professional task is therefore to distinguish the amount of activity completed from the importance of that activity to the outcome.
Priority should consider factors such as critical-path exposure, remaining float, contractual commitments, technical dependencies, safety or quality implications, recovery difficulty, and the time available to intervene.
DECIDE — What Decision Does the Evidence Support?
The purpose of analysis is ultimately to support action. Once the relevant condition has been identified, determine what decision the evidence actually justifies. The response should address the condition affecting the outcome rather than simply reacting to the progress percentage.
For example, if 78% reported progress is accompanied by deteriorating commissioning readiness and delayed technical approvals, management may need to protect specialist resources, accelerate decisions, resolve interfaces, or reassess the milestone forecast. The appropriate response depends on the evidence behind the exposure.
A useful decision should therefore make the intended intervention clear:
- What needs to change?
- Why does it matter?
- Who owns the response?
- What project condition should improve?
VERIFY — Did the Decision Improve the Project Condition?
The final step closes the control loop. After action is taken, verify whether the underlying project condition actually improved. Recording an action as complete does not demonstrate that the problem has been resolved.
Verification might show improved critical-path float, resolved approvals, stronger commissioning readiness, reduced risk exposure, improved quality performance, or a more credible forecast. The specific evidence should reflect the condition that prompted the decision.
This final step also creates learning. If the expected improvement does not occur, professionals can reassess the diagnosis, measurement basis, assumptions, or chosen response. Consequently, project control becomes a continuing feedback process rather than a reporting cycle that ends when the status report is issued.
The complete Kleios lens is therefore:
- Measure what has actually been accomplished.
- Contextualize what the measure does and does not represent.
- Cross-check the signal against other relevant evidence.
- Prioritize the condition that matters most to the outcome.
- Decide what action the evidence genuinely supports.
- Verify whether the action improved the project condition.
The central principle is simple: progress measurement should be treated as evidence, not as a verdict. Progress Measurements Mislead when interpretation stops at the number. A stronger professional approach trusts a measure for what it actually measures, questions what it excludes, and connects it to decisions only after its context has been understood.
Key Takeaways
Progress measurement remains essential to project control, but it should not be treated as a complete verdict on project performance. The central lesson is that Progress Measurements Mislead when professionals interpret a valid measure beyond the evidence it can reasonably provide.
- Progress is one dimension of project condition. A strong progress percentage does not automatically confirm schedule, quality, readiness, risk, or outcome performance.
- Measurement accuracy and decision accuracy are different. A number can correctly represent its defined measurement basis while still being insufficient for a particular management decision.
- Aggregation can conceal strategically important problems. Project-level progress may hide deterioration on critical-path activities, interfaces, dependencies, or high-risk remaining work.
- Work accomplishment is not always outcome achievement. Earned progress should be considered alongside quality, testing, approvals, commissioning, integration, and acceptance conditions.
- Leading conditions deserve attention before progress deteriorates. Delayed decisions, constrained resources, procurement issues, and unresolved dependencies can affect future performance before the progress metric visibly changes.
- Professional judgement remains essential. Metrics provide evidence, but professionals must determine what the evidence means, which condition matters most, and what action is justified.
A practical discipline is to Measure → Contextualize → Cross-check → Prioritize → Decide → Verify. This keeps progress information connected to project reality and management action rather than allowing a single percentage to become a substitute for professional judgement.
References
This Insight draws on international standards, government guidance, professional bodies, and research examining earned value, progress measurement, project controls, measurement uncertainty, performance metrics, and the interpretation of project evidence.
- ISO 21508:2026 — Project, programme and portfolio management — Earned value management — current international guidance on EVM purpose, processes, systems, and application.
- GAO-20-195G — Cost Estimating and Assessment Guide — government guidance on reliable performance measurement and earned value management.
- NDIA IPMD — A Guide to Managing Programs Using Predictive Measures — guidance on predictive measures and the limitations of aggregated schedule performance indicators.
- The Impact of Uncertainty in the Measurement of Progress in Earned Value Analysis — research examining uncertainty introduced through progress measurement and its effect on earned value analysis.
- Performance Monitoring of Project Earned Value considering Scope and Quality — research examining how scope and quality considerations can affect conventional EVM performance monitoring.
- Metrics That Matter: Evaluation of Metrics and Indicators for Project Progress Measurement, Performance Assessment, and Performance Forecasting during Construction — research examining the use and interpretation of project performance metrics.
- Critical Barriers to Traditional Project Progress Measurement: Perspectives of Ghanaian Construction Professionals — empirical research examining subjectivity, inconsistency, and other barriers affecting traditional progress measurement.
- NASA EVM Tutorial — practical guidance on objective measurement, earned value, schedule performance, and EVM analysis.
- DOE G 413.3-10B — Integrated Project Management Using the Earned Value Management System — guidance on integrating earned value with project planning, execution, performance measurement, and control.
- Earned Value Management — current professional guidance emphasizing data quality, timing, trends, interpretation, and management decisions rather than metrics alone.
Related Kleios Resources
Understanding when progress measurements can mislead is only one part of effective project controls. The following Kleios resources provide practical guidance and tools for measuring progress, interpreting performance, monitoring cost and schedule, and strengthening project controls.
- How to Measure Project Progress Accurately — Understand practical approaches to defining, measuring, and validating project progress.
- How to Monitor Project Cost and Schedule — Connect cost and schedule information to a broader view of project performance.
- How to Prepare Effective Project Controls Reports — Build reporting that communicates project performance, emerging issues, and management-relevant information clearly.
- Project Progress Measurement Template — Apply a structured framework for recording and assessing project progress.
- Cost-Schedule Performance Template — Bring cost and schedule performance information together to support more informed project analysis.
- Project Controls Reporting Template — Structure project controls information into a practical reporting framework for monitoring and decision support.
- Project Controls Resources — Explore the broader Kleios Project Controls resource hub, including guides, templates, and other practical resources.
Together, these resources support a broader project-controls discipline: measure the work, understand the evidence, interpret the context, and connect performance information to better decisions.
FEATURED PROJECT CONTROLS INSIGHTS
Professional Perspectives on the Challenges Project Controls Face
Our featured Project Controls Insights examine recurring challenges involving early warning signals, cost variances, progress measurement, forecasting, reporting, and integrated performance. Moreover, they encourage professionals to look beyond reported figures and consider the conditions influencing them.
Why do Project Cost Forecasts Lose Reliability
Examine why Cost Forecasts Lose Reliability despite established forecasting processes and available project data. Moreover, consider how actual costs, commitments, accruals, assumptions, and performance trends can affect forecast quality.
When does Project Controls Reporting Value Decline?
Examine when Project Controls Reports contain extensive information but provide limited management value. As a result, consider whether reporting remains timely, relevant, understandable, and connected to project decisions.
Why Cost and Schedule Performance Diverge?
Explore why Cost and Schedule Performance can move differently during project execution. Instead, examine whether these signals reflect separate conditions or reveal connected underlying performance issues.
MORE PROJECT CONTROLS RESOURCE TYPES
Continue Your Project Controls Learning
Project controls knowledge becomes more valuable when professionals can understand concepts, apply structured tools, and examine their practical use. Explore our other Project Controls resources to complement the analytical perspectives provided by these Insights.
Guides
Explore clear guidance to understand project controls concepts, evaluate performance, and apply effective approaches throughout project delivery.
Downloads
Access useful project controls materials and reference resources to support learning, analysis, and day-to-day project work.
Career Roadmaps
Follow structured learning paths to develop project controls knowledge, practical skills, tools, and capabilities for professional growth.
Templates
Use structured Project Controls templates to support setup, progress measurement, cost analysis, forecasting, performance monitoring, and reporting.
Case Studies
Explore realistic project controls situations, decisions, challenges, and outcomes to understand how control practices work during project delivery.
Glossary
Find clear explanations of project controls, cost management, progress measurement, forecasting, performance analysis, reporting, and related terminology.
Looking for more project management resources? Explore the Kleios Technologies Resources Hub to discover our complete collection of guides, templates, downloads, career roadmaps, case studies, glossary resources, and insights.
RELATED KNOWLEDGE DOMAINS
Continue Your Learning Across Related Knowledge Domains
Project Management is closely connected with specialized disciplines that support successful planning, execution, governance, performance measurement, and professional growth. Explore related knowledge domains to expand your expertise, develop complementary skills, and access practical resources across the complete project management ecosystem.
Expand your expertise one domain at a time and build a well-rounded project management skill set.
Why Explore Related Domains?
- Develop cross-functional project management expertise
- Discover specialized knowledge beyond core project management
- Access practical resources across interconnected disciplines
- Build a complete professional learning pathway
- Strengthen career readiness through continuous learning
Project Management
Practical project management knowledge, practices, and professional resources.
Project Planning & Scheduling
Planning techniques, scheduling methods, and timeline management resources.
PMO
Governance, portfolio management, and organizational project excellence.
Risk Management
Risk identification, assessment, mitigation, and monitoring resources.
Primavera P6
Professional planning, scheduling, resource management, and reporting.
Microsoft Project
Project scheduling, tracking, reporting, and collaboration resources.
Power BI
Interactive dashboards, reporting, visualization, and project analytics.
PMI Certifications
Certification guidance, exam preparation, and professional development resources.